Focus
Specialization
Biography
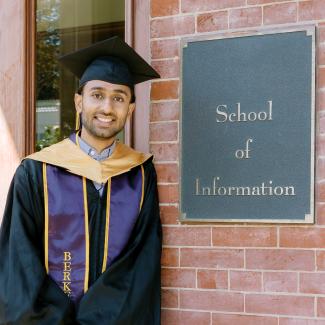
During my master's at the School of Information, I worked at the Othering & Belonging Institute (1 below) and spent the summer between the program in New York City implementing insights from Dr. Marti Hearst's INFO247: Information Visualization and Presentation (2) as a Data and Communications Strategy Fellow at Breakwater Strategy under professor emeritus of the I School, Steve Weber.
Before Berkeley, I worked in Hong Kong as the Centre for Asian Philanthropy and Society’s primary Data Resource (3), and served as Senior Data Analyst at Centre for Economics Research in Lahore, Pakistan helping implement an ambitious research study led by eminent economists (4).
I hold a bachelor’s in Economics (with a minor in Sociology) from LUMS, Lahore, Pakistan.
I am happy to discuss work opportunities (Open To Work from 8/1) or collaborations.
Experience
1. Single-Family Zoning in California: A Statewide Analysis (August ‘21 to May ‘24): Author and Data Lead for a study of the extent and impact of single-family zoning across all of California (481 cities) using spatial (ArcGIS) and data analysis (R) and automation (Python). This project is the Institute’s flagship effort on Zoning Reform. I also helped transition another product’s analysis from Excel to R (currently in use); and wrote testing software in R (testthat) to ensure reliability of a statewide information visualisation tool.
2. Excelling at Telling Stories with Data: Blogpost and concluding exercise of my 3-month Summer Fellowship at Breakwater Strategy–a boutique strategic communications firm working with household brands–where I provided Data Visualization Leadership. I Updated 50+ client-facing data visualisation slides; templatized my work for reuse and extension; steered a culture of data visualisation by leading 4 bi-weekly company-wide data visualization discussions; and authored a data-viz focused organisational plan to differentiate Breakwater Strategy in the industry. This blogpost (linked) received 3500+ impressions.
3. Doing Good Index 2020: Data Lead for data analysis (Stata) and pioneering presentation style of Doing Good Index 2020, the centre’s flagship research product covering 18 Asian economies, as a scrolly telly platform and interactive dashboard (linked). At large, I helped create a more data-focused org by leading an organization-wide transition from Excel to Stata.
4. Rebuilding the Social Compact*: Senior Data Analyst leading implementation of a randomized controlled trial encompassing 113,000 households across 2 major Pakistani metropolitan areas (Lahore and Faisalabad). I led the design and implementation of cutting-edge phone survey products (SurveyCTO); was responsible for data retrieval using webscraping (Python); data cleaning/organisation; field research; stakeholder management; and the design and development of products such as an annual project flyer, personalized to target household’s demographics. (*Brief itself not authored by me.)


