ML-based Investment Analytical Tool
It is challenging for employees to pick the best 401K or IRA funds for themselves, so we wanted to use machine learning to help us identify the best available funds.
Unfortunately, the performance data on most financial institutions’ funds are private so we could not access the data for this project.
New idea:Shift our focus to the stock market (with publically available data) and recommend stocks instead:
- Use machine-learning algorithms to pick the stocks with the highest returns over a given period
- Restricted to stocks in the S&P 500 for simplicity
- We are focused on medium term trades - 30, 45, or 60 days - not daytrading
Detailed System Architecture
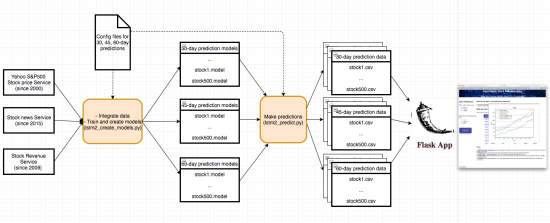
Our system can be broken into three layers: (see picture for Detailed System Architecture)
- Data extraction: extracts stock price, revenue data and news
- Creating model and training data: combines all the data above, creates time-series data for training and test, trains and create models
- Generating prediction data: uses the trained models to generate prediction data
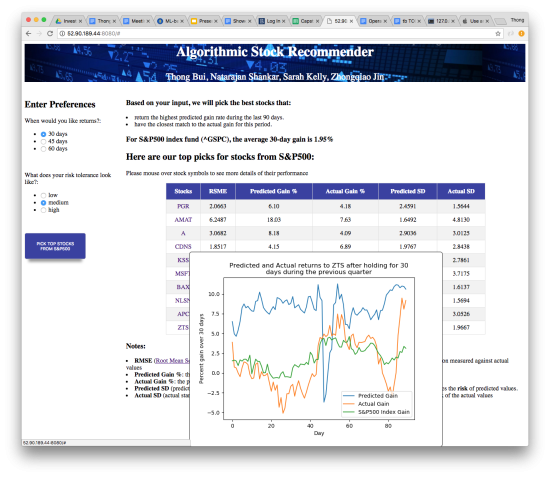
- Flask-based application that takes in input from user's preferences, queries data from the prediction data and makes recommendations for the best choices
Data Collection and Analysis
Data for stocks from the S&P 500 comes from these data sources:
1. Yahoo Finance provides all daily stock prices all the way back from 2000. Because this is to predict longer term stock price (rather than intra-day prices), we chose these features: Adj Close, Volume
2. Google Stock News provides news for each of these 500 stocks but can only go back to 2015. For each of day where news data is available, we extracted a number of features including subjectivity, positivity (from sentiment analysis) and a number of key-word indicators including buy, sell
3. Intrinio Service provides stock revenue data but can only go back to 2009. We are able to extract these attributes: totalgrossprofit, totalrevenue, netincome, basiceps
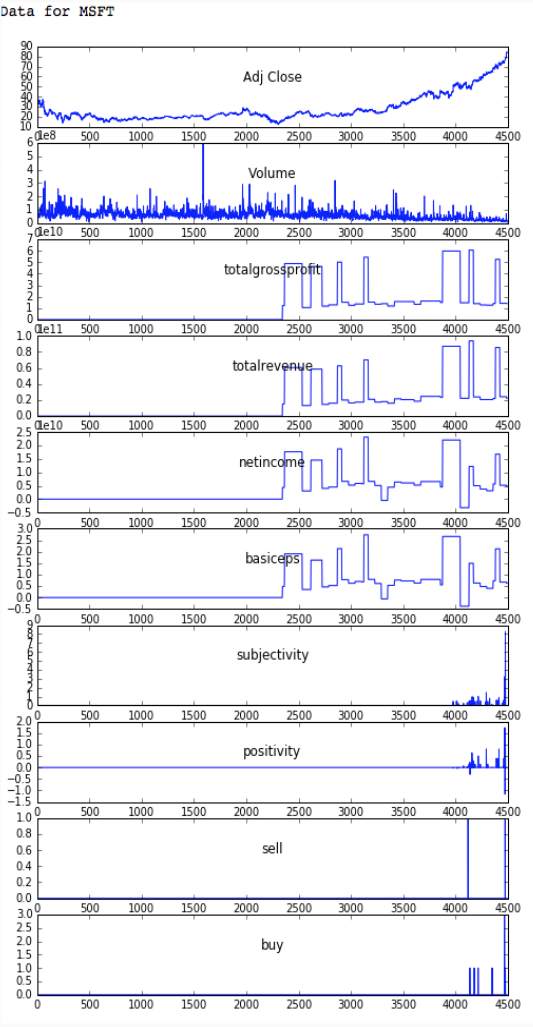
We were able to combine these 3 datasets together with a caveat of a much smaller data, starting from 2015 (see picture of sample data from MSFT). This means that we were not able to include data from the 2008 crash in our model, which reduces the generalizability of our model, especially under recession conditions.
Create Models and Train Data
After combining the 3 datasets into one, we created multivariate (10 variables) time-series dataset as well as the output data of 30, 45, 60 day stock prices. This data was then split into:
* Train data: before the last 90 days.
* Test data: last 90 days
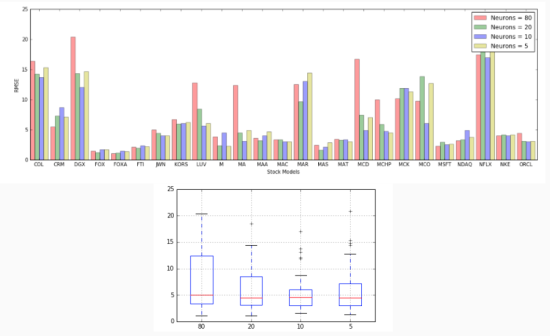
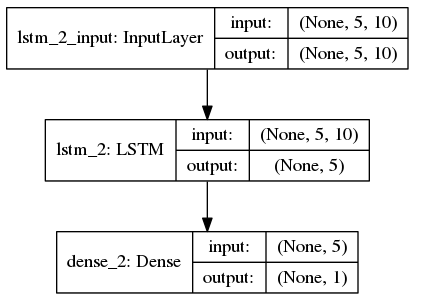
We then created a LSTM model (using Keras), since LSTMS are widely used in predicting time-series results. We also performed some tuning for best number of neurons for the LSTM to yield the most optimal RMSE (Root Mean Squared Error) (see picture - Tuning parameter # of neurons).
Having picked the optimal hyper-parameters, our models was also cross-validated against test data.
Due to smaller limited dataset (since 2015) as we pointed out earlier, we want to minimize overfitting by cross-validating against test data and performing early stopping at certain threshold.
After training, we had 500 models generated and saved each stocks for each of price prediction timeframe (30, 45, 60 days).
Generate and Evaluate Prediction Data
After we created 500 models, they were batched together to generate the predicted values in parallel. For each prediction type, we broke them into 5 batches of 100 stocks and was able to reduce the processing time by 75%.
After the predicted stock prices were generated for the test dataset, we evaluated them against the actual values by calculating:
* RMSE to measure accuracy of the predictions
* Standard deviation to measure the volatility of the stocks during this test period (90 days). This information will be used later by the Web Application to map to user's risk preference
Flask-based Web Application
After two rounds of user testing, our UI’s philosophy is “simplicity is beauty”! We give users only 2 sets of options and return a simple table of recommendations. Our two options are:
Options for forecast types: 30-day, 45-day, 60-day
Options for risk level that they are most comfortable with: low, medium, high. For each forecast type, we classify 500 stocks into 3 groups of equal sizes:
Low risk: predicted SD < 33.33% quantile
Medium risk: predicted SD is between [33.33%, 66.66%]
High risk: predicted SD > 66.66%
Our WebApp is currently visible hosted: http://52.90.189.44:8080/background
Takeaways/Results
This prototype is the proof of concept to show that we can simplify the process of picking the best stocks from S&P500 or any large pool of stocks using time-series and LSTM. It also has the capacity to predict the future stock prices which can be later added to our existing functionalities of the WebApp.
Our current limitations of the dataset we currently have as pointed out earlier can be remedied by paying better services such as Bloomberg’s for a better news and revenue data. Better dataset which will certainly help improve the accuracy of our predictions.
Another area that can be investigated further when time allows is trying with different configurations of LSTM layer to improve the quality of predictions.
Github
https://github.com/thongnbui/MIDS_capstone
- documents: all the documents created for this project
- WebApp: flask webapp code
- code: all the back-end codes
- config: all the config files used
References


