Where should you live?
Buying a home requires a lot of important decisions to be made. New services, such as Zillow's Zestimate, have helped, especially with understanding the valuation of properties. However, some decisions are still difficult due to a lack of key information. For example, for people who are relocating, families with children who are moving for better school districts, or people facing similar real estate options in different neighborhoods, there is a lack of services that provide them with the information which can help them to easily make decisions. How can existing data be used to facilitate decisions in these scenarios? We set out to create a product that can better people's user experience while searching for houses, assist users in making investment decisions, and provide neighborhood comparisons. Such a product is important, not only because it can bridge the gaps in the key information users may want when they're looking for a house and help them save them, but also help businesses retain their employees by providing a product that employees can take advantage of when they're asked to relocate.
We got our inspiration from the Walk Score, which incorporates different aspects of neighborhoods, such as number of parks and types of transit available. We wanted to explore parameters that people don't normally think about, but that may have an impact on neighborhood differentiation. We explored many datasets (for the list of data we used, please refer to our presentation slides), and set out to create metrics that will help users understand a neighborhood. We thus incorporated different elements of a neighborhood and developed different scores. We created four scores: Quality Score, Personal Score, Investment Score, and Similarity Score:
- Quality Score: We first selected a large set of data points that correlate with the quality of a neighborhood. We used the median house price as a proxy for quality. From there, we used AIC/BIC to do feature selection, and used multiple regression to calculate the weight of each selected feature. A score is then calculated using regression-weighted coefficients.
- Personal Score: We wanted to take personal preference into consideration when comparing neighborhoods. We conducted a survey amongst friends and colleagues to select a list of parameters that matter the most to people when they are looking for houses. The score is dynamically calculated based on the user's input, and it's ultimately a measure of how likely it is that the user would find the neighborhood likeable.
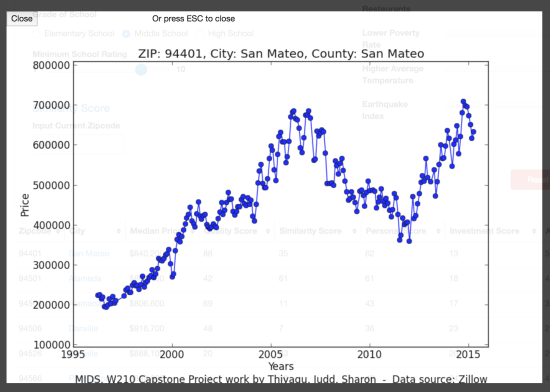
- Investment Score: We want to provide a metric that offers an indication of the price trend for a neighborhood. We calculated this metric by fitting a price trend line to the per-month average median house price data of the past 20 years that we obtained from Zillow. A score is then derived from the coefficient of the trend line.
- Similarity Score: We got the inspiration of the similarity score from recommender systems such as Amazon and Netflix. Assuming the user likes where they are currently living, or has a specific zip code that they know they like, the similarity score provides users with a metric that measures how similar a zip code is to the zip code they input. After evaluating several distance functions, such as Manhattan, Euclidian, Cosine, Hamming, and Jaccard, we selected the Euclidian Distance since our input data is all numeric. Click here for more information on the methodology.
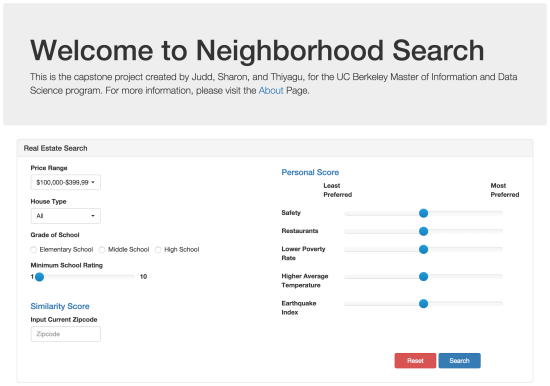
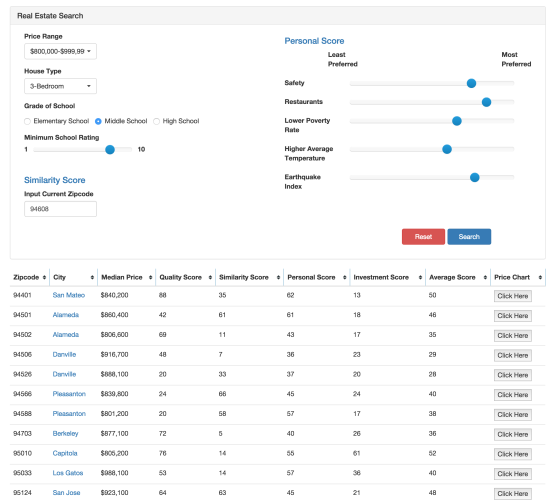
For the product, users are asked to input their preference on real estate price range, house type, neighborhood characteristic parameters for personal score calculation, preferred zip code for similarity score calculation, along with optional inputs for school type and minimum school rating. The school-related inputs are mainly implemented for families with children, to help them narrow down on neighborhoods that fit their search criteria. To help the user understand the metrics and thus compare different neighborhoods more easily, scores are first calculated based on user input, and scaled before filters, such as pricing and school ratings, are applied. The scores are kept between 0 and 100. In terms of evaluating accuracy, we did some sample searches to see if the results are in line with what we would expect. For example, a search for a $800K-$1M 3 bedroom house similar to one in Danville, CA yielded results such as San Mateo, Pleasanton, and San Jose. All of these output zip codes are suburban areas very comparable to the Danville area. In the current stage of the product, the only way to evaluate accuracy is to analyze the output results, and decide if the output makes sense. In the future, we hope to have a deeper integration with real estate database products such as Zillow, and to be able to evaluate our model accuracy by analyzing user behavior in housing search after they use our product.
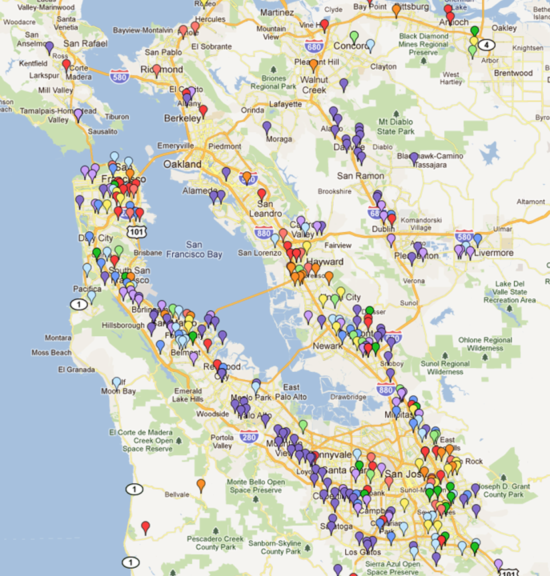
For our project, we used San Francisco Bay Area neighborhood as our test area and deliverable. In the future, we will scale to incorporate different neighborhoods in United States. In addition, we would like to add a map to plot our outputs, allow users to narrow down search area (such as within 50 miles of a certain zip code), enhance recommender system by allowing a range of ratings on multiple zip codes, and conduct experiments to validate the scores and revise calculations as necessary.


