Hawk Eye - Digesting Financial Articles Through Data Visualization
This project aims at providing investors and readers of financial news articles an easier alternative to relate sentiment, articles, and key ideas of each article efficiently through data visualization. The projected is delivered based on the following three core principles:
- One needs to easily know the overall sentiment of an article and how it ties with the stock price
- One needs to easily see the connections between the any article and others
- One needs to be able to grasp the core idea of any article quickly
As a result, we have developed the tool into three orthogonal yet integrated sections:
- The top section shows the stock price on one y-axis and the sentiment of each article on the other y-axis
- The bottom left shows different topic clusters in different colors, and each node represents a topic cluster
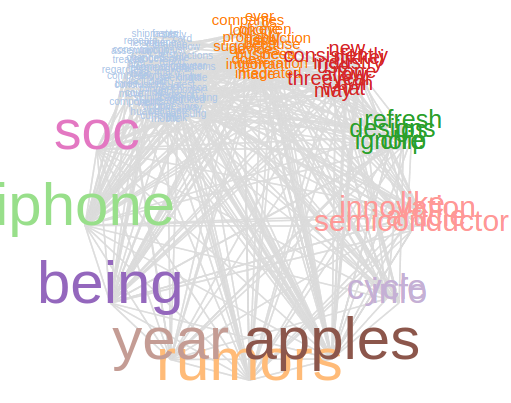
- The bottom right shows the keyword network once an article is chosen by the user (i.e. user decides to 'drill down' for more details on a specific article)
- We've built in highlights and interactions among the abovementioned three components so when the user clicks on one node (i.e. article) in the bottom left graph, the top graph will highlight the point selected and the bottom right graph will pop out the keyword network, and vice versa, so the user will not lose context.
Topic and text analysis are done using Machine Learning and Python, while all front end renderings are done using a combination of Javascript, Coffee script, and D3.


