Erratum.io
Problem Description
Many companies store attributes of entities like customers and products in large, dimensional tables within an application or data warehouse. These “master data” tables contain descriptive fields, usually text, that characterize their related entities. For example, a customer may be tagged as ‘Retail – US,’ or a product may be categorized under its brand or department. Through relational queries, master data dimensions are joined to every transaction involving that customer or product, meaning that any master data error is propagated throughout the database; if an item’s brand field on the master data table is incorrect, every sale of that item will accrue to that incorrect brand. Minor errors in a master data table can easily affect reporting for every business by millions of dollars.
To safeguard their systems, companies employ teams of master data analysts to review the quality of all modifications to master data tables. Shifting business requirements often leave master data in a constant state of flux; new products are added, multiple customers are combined through acquisition, or existing products are rebranded. The requirements for these changes are frequently generated by experts outside of the master data team, who may accidentally omit a record from their request or give instructions that are too broad, e.g. “Update every 12 o.z. product to the new brand.” With potentially thousands of individual values to manage, almost all master data tables accumulate some amount of error, though generally less than 10% of records are affected, but master data analysts often lack the technical skills to seek out the mistakes present in their data.
Our product uses unsupervised anomaly detection methods to identify potentially incorrect master data entries automatically, without time-consuming rule-creation. We put the power of machine learning to work, protecting the enterprise's most high-risk data and empowering non-technical users.
Data Visualization
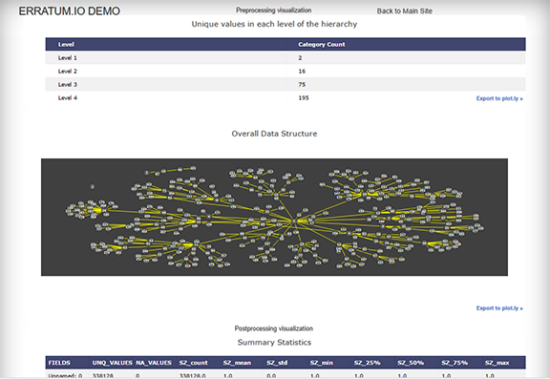
To help non-technical users deal with their hierarchical data issues; we utilize internally developed algorithms and graph models to visualize complex hierarchical datasets. Interactive charts of hierarchical graph trees are generated and allow users to see relationships between different levels of data hierarchies. Our product can potentially visualize data with millions of records.
Input hierarchical data is visualized in three ways: data structure of the original input data, data structure of the records predicted to be corrected organized and data structure of the records predicted to be erroneous. Observing the branches and nodes in each of the graph charts allow users to see where errors are mostly likely to occur. Most importantly, our product enable many users to observe relationships in their hierarchical dataset for the first time.
Modeling
Our product tackles unsupervised anomaly detection through two assumptions common to master data. First, overall quality in master data is generally high; 90-95% of records are completely correct. Second, hierarchies are inherent in most master data, aggregating products, for instance, into brands, categories, and departments. These patterns, though difficult to appreciate by manual review of the data, are easily quantified. For example, how many items typically belong to each brand? How many brands belong to multiple categories? Or how many items that belong to the same brand and category are assigned to multiple departments? Combined with our assumption of strong data quality, we calculate the numeric metadata for each record’s position in the hierarchy and then apply anomaly detection methods to find outliers. In addition, we generated TFIDF vectors for the lowest level of our hierarchy, item name, and applied PCA to convert the TFIDF vectors into two features.
We applied the sklearn implementation of Isolation Forest to the generated metadata and returned the original master data with the model’s output: -1 for an outlier and 1 for a correct record. One useful feature of Isolation Forests is that we were able to vary the number of estimators to prioritize either quicker response from the model or more accurate results.
Results
The sub-set of Best Buy data with a four-layer hierarchy contained 338,128 records. To validate our model’s effectiveness, we generated error in 16,615 records (5.0%), changing a field’s value from the correct value to a value chosen at random from the other values present in the dataset. With 5% error present in our data, the model flagged 17,027 records (5.0%) as outliers. Of those flagged, 9,852 records did contain a manufactured error, yielding a precision of 58% and recall of 59%.


