Global Climate Shifts
Objective
Our project aims to give some preliminary education about the cause and effects of rising surface temperatures, to people who don’t have a ton of exposure to the topic or to people who have some exposure but are looking for some evidence to back up these conclusions. We made a site that was simple and accessible, and provides a gentle introduction to environmental education without being too overwhelming or intimidating.
The Story
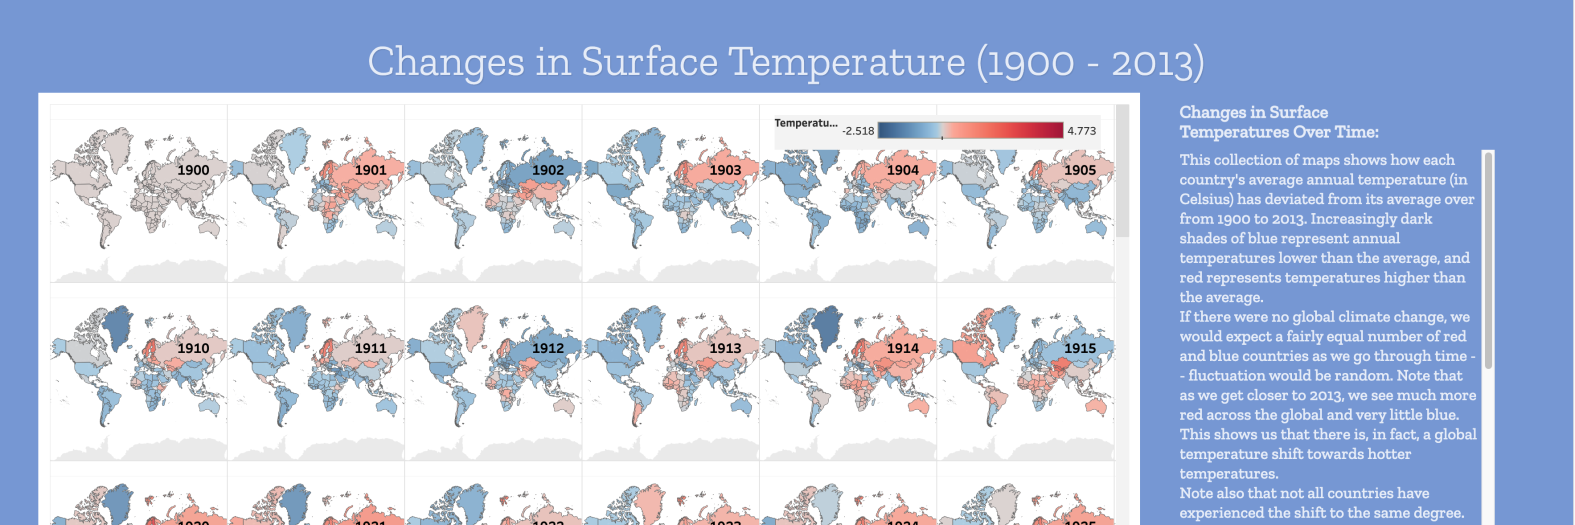
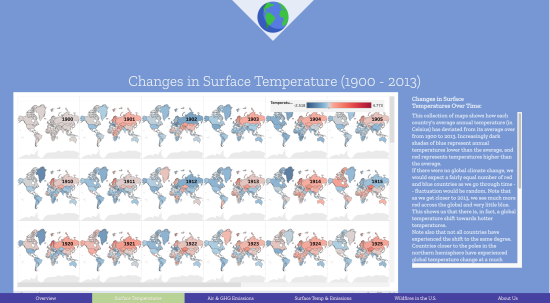
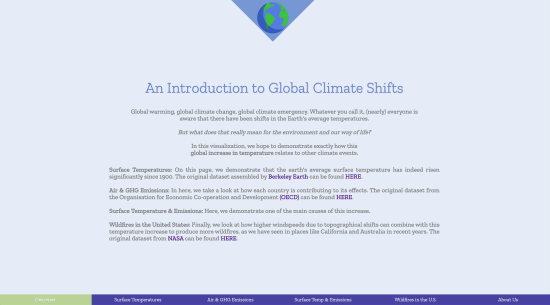
The structure of the project is somewhat narrative. First, the viewer is given an overview of the topic. Then, it is demonstrated (using a small multiples map) how much the surface temperature has risen from 1900 until now. On the next panel, we demonstrate one of the causes for this rise in surface temperatures -- air and greenhouse gas (GHG) emissions -- in an interactive visual dashboard. A fourth panel displays each country’s contribution to each emission type, which we hope makes people think about their own emission footprint relative to the world. Finally, we zoom in to one of the many environmental problems caused by rising surface temperatures, which is the uptick in wildfires in recent decades. We attempt to uncover the fact that wildfires could be managed much better if anthropogenic (human-caused) global temperature shift becomes more moderate in the future.
Within the site are also hyperlinks to other sources of data, info, and visualizations on the same topic, and we imagine users can use our viz as a starting-off point to learn more about environmental issues. Rather than trying to teach everything at once in one go, we hope our visualization sparks curiosity in the viewer.


