Breast Cancer Data Visualization Group Project
Project: https://apps-fall21.ischool.berkeley.edu/BreastCancerDataVis/
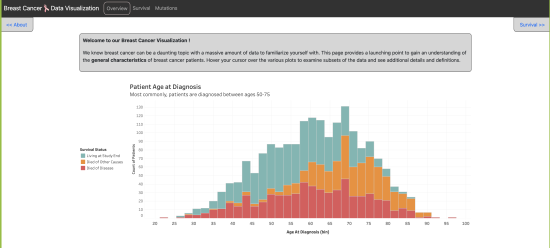
Welcome to our Breast Cancer Visualization! We hope this page finds you well.
Breast cancer is the most common cancer among women, impacting 2.1 million women each year. Because of this, we have created a series of data visualizations intended to be used by breast cancer patients, their family members, and friends.
Our hope is that you use the data presented here to gain a deeper understanding of the general characteristics, survival trends, and genetic traits of breast cancer patients.
Using this data, you’ll be able to compare yourself (or loved one) to other patients and familiarize yourself with common breast cancer terminology. You may even find something you are curious about and ask your doctor!
User
Breast Cancer patients, their family members, and friends
Task
Gain a deeper understanding of the general characteristics, survival trends, and genetic traits of breast cancer patients
Data
The data used on this website is taken from the Molecular Taxonomy of Breast Cancer International Consortium (METABRIC) project, which is a peer reviewed research study published in Nature Communications. The goal of the study was to better understand the relationship between clinical characteristics, genetic profiles, and prognoses for breast cancer patients.The dataset contains clinical characteristics, gene expression levels, and gene mutation information for 1,904 breast cancer patients.
The full dataset can be found as a .csv file at the following link: https://www.kaggle.com/raghadalharbi/breast-cancer-gene-expression-prof….
Navigation
Navigate through the tabs at the top of the page to see data visualizations conveying patient clinical characteristics, survival outcomes, and genetic mutation information.
Professor
Fereshteh Amini: amini@ischool.berkeley.edu
Team
- Hsuan Yi Cheng : hsuanyi@ischool.berkeley.edu
- Lindsay Ng : lindsay.ng@ischool.berkeley.edu
- Natasha Flowers : natasha.flowers@ischool.berkeley.edu
- Yi Zhang : yizhang2020@ischool.berkeley.edu


