Helping Airbnb hosts price and market their properties with better information about business opportunities.
Breast cancer is the most common cancer among women, impacting 2.1 million women each year. Because of this, we have created a series of data visualizations…
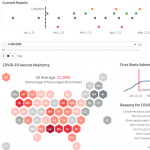
Tool for helping health and government officials as well as the general public visualize and understand COVID-19 trends.
A fun and interactive way to compare salaries of various occupations. The scale also makes it easy to see the disparity in income between some occupations like…
COVID-19 vaccination trends in the United States since January 2021 from three different perspectives.
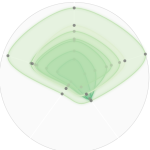
Visualize the hidden features within songs and how they have changed over time.
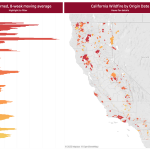
Data visualization web project exploring historical wildfire trends, air quality, and grape production in California


")