Cryptocurrency Visualization
Visualization's Goal
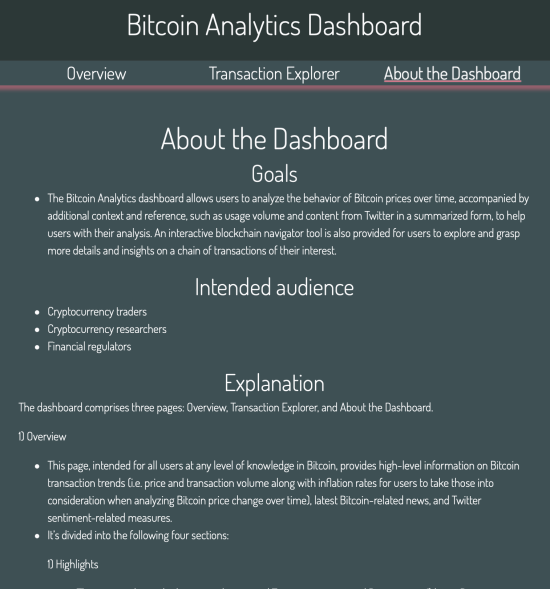
- The dashboard consists of three pages: Overview, Transaction Explorer, and About pages with different goals in mind.
- Overview
- The goal is to allow users to analyze the behavior of Bitcoin prices over time along with additional context and references such as transaction volume and Twitter sentiment measures for users to grasp a better understanding around Bitcoin.
- Transaction Explorer
- The goal is to allow users to perform more in-depth analysis of transactions of their interest, where users can explore and get more insights of all related transactions through transaction network analysis.
- About
- This page is to provide explanatory text about the goal, intended audience, and data source of the dashboard along with contributors.
Intended Audience
- Cryptocurrency traders
- Cryptocurrency researchers
- Financial regulators
Data Sources
- Bitcoin price & trasactions
- Blockchain.info
- Coindesk
- Inflation rates
- statbureau.org
- Sentiment
Detailed Dashboard Explanation
-
The dashboard comprises three pages: Overview, Transaction Explorer, and About the Dashboard.
-
Overview
-
This page, intended for all users at any level of knowledge in Bitcoin, provides high-level information on Bitcoin transaction trends (i.e. price and transaction volume along with inflation rates for users to take those into consideration when analyzing Bitcoin price change over time), latest Bitcoin-related news, and Twitter sentiment-related measures.
-
It’s divided into the following four sections:
-
Highlights
-
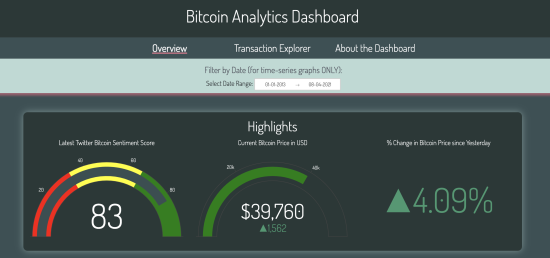
This section shows the latest number around Twitter sentiment and Bitcoin price: 1) latest Bitcoin sentiment score that ranges from 0 to 100 with 0 being the most negative sentiment and 100 being the most positive sentiment, 2) latest Bitcoin price with exact values of current Bitcoin price and the price change from the last 24 hours, marked with green if the number has increased or red if the number has decreased, and 3) % change in Bitcoin price from yesterday, again, denoted with green if there was a positive change or red if there was a negative change.
-
- Bitcoin Price Trends
-
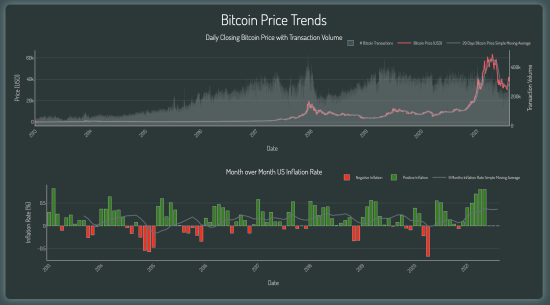
The date range selector available on the top of the page applies its changes to all graphs in this section dynamically.
-
This section shows two graphs vertically.
The first graph, Daily Closing Bitcoin Price with Transaction Volume, shows 1) the main metric, Bitcoin price, as a pink line, 2) the context/supporting metric, Bitcoin transaction volume, as a bar overlaid in the back, and 3) 30-day moving average of Bitcoin price as a grey line.
Users can get a sense of how Bitcoin prices and transaction amounts have been changing over the range of dates of their interest.
The second graph, Month over Month US Inflation Rate, provides information on how inflation rates in the US have been fluctuating month over month to provide more context to users by allowing them to look at these two graphs together to grasp a better understanding around Bitcoin price and transaction trends.
Positive inflation rates are depicted as a green bar, and negative inflation rates are depicted as a red bar in addition to the 9-month moving average of inflation rates in a grey line.
In both graphs, any metric can be unselected or selected to hide or highlight the metric(s) of users’ interests by clicking the corresponding metric(s) in the label part of the graphs.
Users can also filter the data by highlighting the portion of the graphs that they would like to zoom in.
-
-
Twitter Bitcoin Sentiment
-
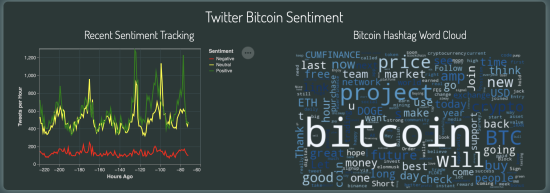
This section contains Recent Sentiment Tracking, which is a line graph built using Altair that shows a hourly number of Bitcoin tweets broken down by sentiment (i.e. positive as green, neutral as yellow, and negative as red), and Bitcoin Hashtag Word Cloud, which is a word cloud that shows Twitter Bitcoin hashtags with the frequency of hashtags that were tagged in tweets distinguished by the size of texts.
-
- Recent Bitcoin Newsfeed
-
This section contains a list of most recent Bitcoin-related news headlines along with their links in real-time, which are opened in a new tab once clicked by users for them to read the actual articles if needed.
-
-
-
-
Transaction Explorer
-
This page, intended more for users with a better understanding in Bitcoin, allows users to investigate the related transactions of Bitcoin wallets of their interest and get more insights.
-
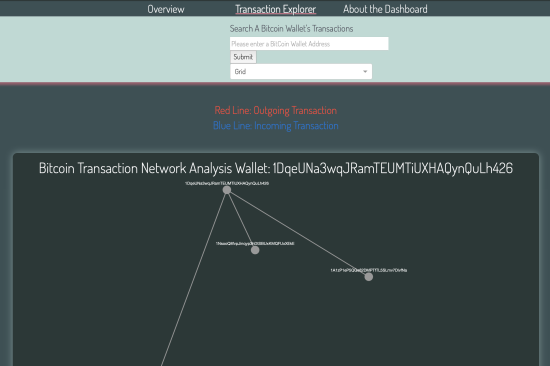
Bitcoin Transaction Network Analysis Wallet is a network graph that dynamically shows all linked transactions of the Bitcoin wallet entered in the text input box available on the top of the page.
-
Users can also select a network representation algorithm via a dropdown box available after the text input box to dynamically change the display mode of the network to suit their needs.
-
-
About the Dashboard
- This page contains all information about the dashboard for first-time dashboard visitors.


