

")


An Exploration of Biological Response to Anthropomorphized Stimuli Using Gaze-Tracking and EDA Biofeedback
Introduction
Anthropomorphization and teleological explanations for objects and processes have been hotly debated in pedagogical research, with some factions asserting that the use of such tactics simply confuses young students (Kallery et al), while others assert that use of these techniques may actually help with understanding and recall, especially in more mature populations (Stoos et al).
Our aim is to investigate the variance in biosignal response as it relates to different types of anthropomorphization. By measuring biofeedback, we can quantify our participants’ responses to various forms of anthropomorphic stimuli. We measured two different forms of biofeedback for our analysis: eye-tracking and Electrodermal Activity (EDA). If we assume that there is an intrinsic relationship between biosensory activity and ‘engagement’ or ‘attention’, we can then extrapolate our results and generate inferences about which forms of anthropomorphism garners the most attention.
These inferences can then be applied in industries that are dependent on ‘attention’. One field that is dependent on attention that could utilize this information is that of pedagogy (Chiong et al, Larsen et al). Teachers could utilize anthropomorphic stimuli in their lesson plans in order to keep their student’s attention during long lessons. Or, teachers could associate difficult to understand or remember concepts with a story in order make the concept more relatable to their students.
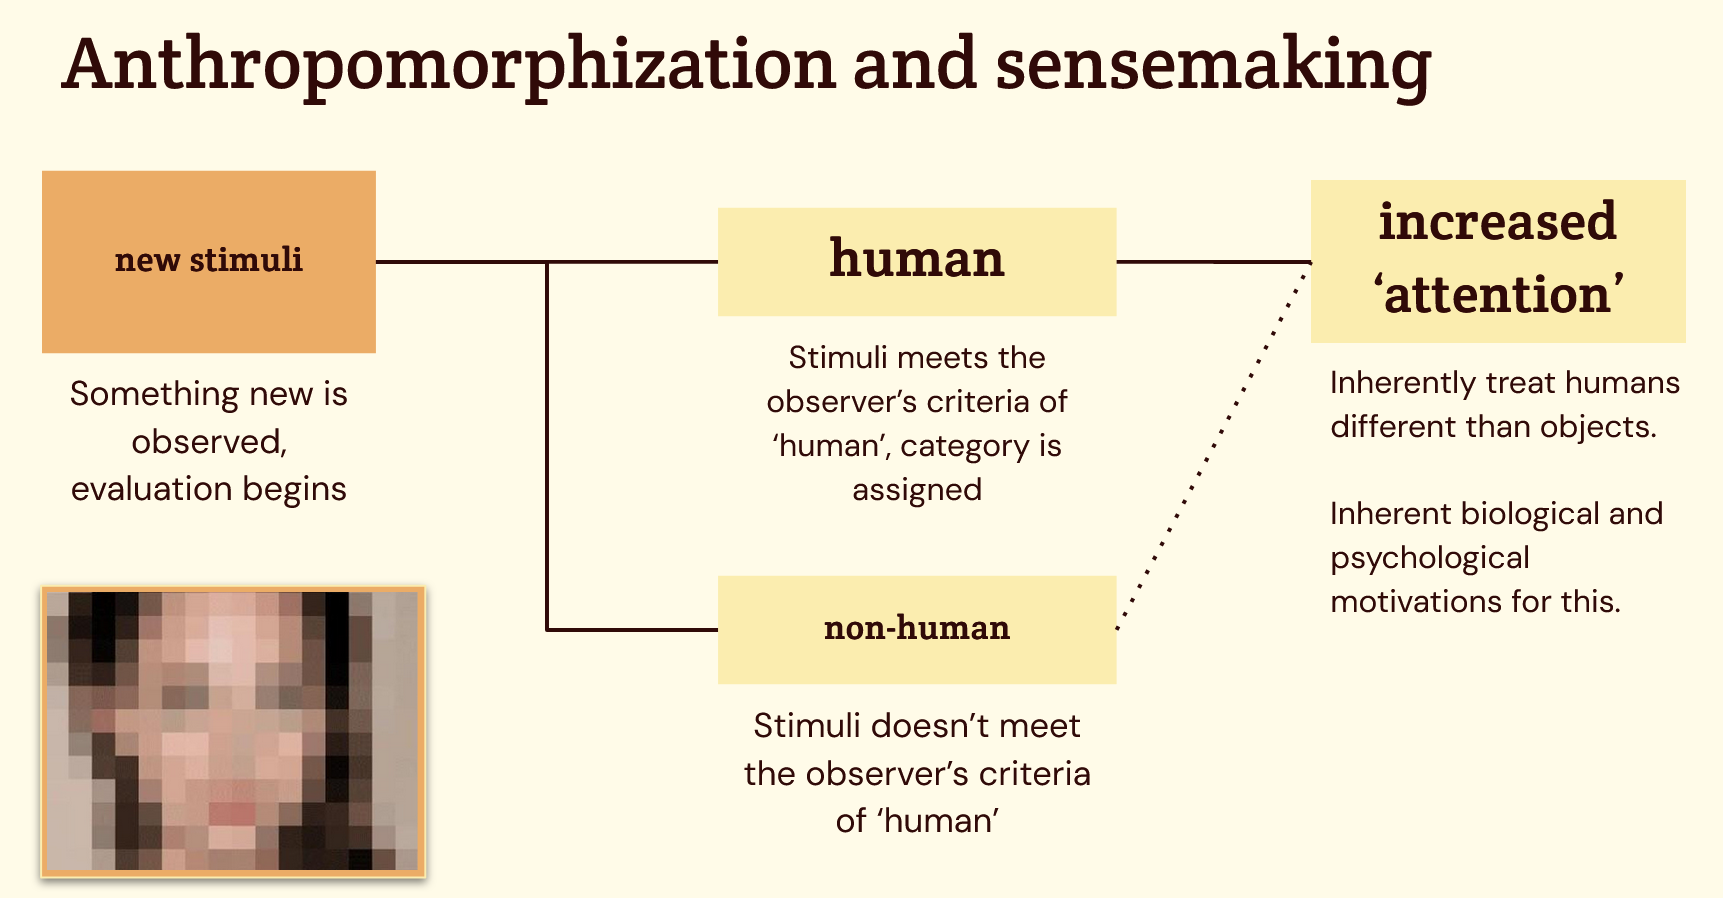
The findings may also be applicable to discourse surrounding cognition and dehumanization (Waytz et al). When we anthropomorphize our surroundings, we are attributing both physical and non-physical human characteristics to the subject. We might associate the subject with a human face, but we may also attribute emotions (e.g., joy, grief, sadness), cognitive awareness, or moral intent to the subject. There are wide ranging consequences and implications of non-human subjects being perceived as having complex mental faculties. Non-human subjects “that are capable of judgment, intention, and feeling are also capable of directing their judgment, intentions, and feelings toward us, and therefore become agents of social influence” (Waytz et al). Further, if we collectively perceive that a non-human subject is capable of complex mental faculties, does that make the subject worthy of moral care and protection that are typically reserved for humans (Waytz et al)? While our experiment evaluating participants’ responses to anthropomorphization has direct utility in attention-dependent fields like pedagogy, it also has the potential to speak to larger concerns regarding the human condition and possible extensions of what it means to be human.
Methods
To conduct this study, we presented our participants with three types of stimuli in blocks, as shown in Appendix A, and summarized in the following paragraph. Participants will be wearing eye-tracking (Pupil Invisible) and EDA (Empatica Embrace+) sensors during the experiment in order for us to receive a variety of possible biosensor data that we can analyze against the hypotheses stated above. Each sensor was calibrated prior to gathering data to account for variations in the participant’s distance to the display showing the stimuli video, lighting in the room, and other fluctuations caused by the hardware. Our methodology for calibration is given in the ‘Calibration Methodology’ section below.
We will present our participants with 3 different categories of anthropomorphized images, each containing the same 15 images, but with slight modifications across groups. Each image (a unit in a block of stimuli) will be shown for 10 seconds. Each image shows a non-human object or scene, but contains something that resembles eyes (to create a focal point for fixation tracking). These images have been rendered as six videos, each representing one of different permutations of group types, each video and recording session lasting approximately 7 minutes.
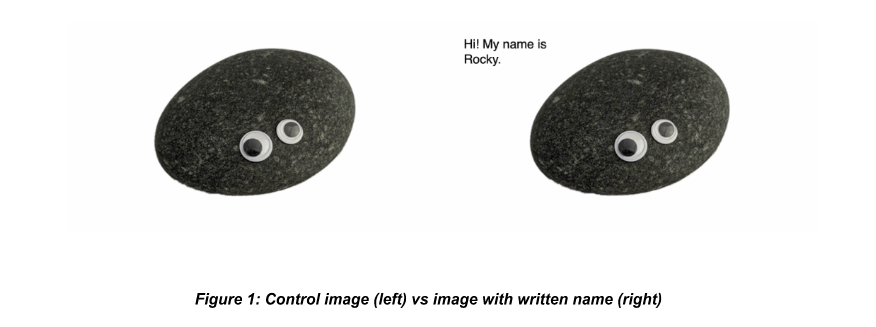
One stimuli category represents a control group of ‘base’ anthropomorphic characteristics, solely containing images without any additional context. This is our control group. Our ‘named’ group is composed of images presented alongside a moniker and a greeting in written form. The final group, our ‘backstory’ group, contains images presented with an audio track that creates a backstory for the object in the image. To account for the order in which images are presented, we will randomize (with removal) the order that each category is presented to participants.
To collect data, the recorder will place both sensors on the participant. Once the devices are on, the recorder will begin the recording on Empatica Embrace+ while simultaneously starting a stopwatch. At the 15 second mark, we begin recording the Pupil Invisible. At the 30 second mark, we begin the stimulus video. The video shown will correspond with a random number generated between 1 and 6 (inclusive) by the recorder, which randomizes the order in which the participant sees each group of stimuli. At the end of the stimulus video, as soon as the white slide shows, we wait an additional 15 seconds then end the recording on the Pupil Invisible. Finally, after another 15 seconds passes (30 seconds after the video ends), the recorder will stop the recording on the Empatica Embrace+. Should any of these devices not work during the recording, it shall be marked in the participant log and device start/end recording shall still be spaced by 15 second increments.
After collecting data, we conducted analyses of both sets of data from all the three devices across participants using the methods applied in Assignments 1, 2 and 4 to see if participant reactions differed enough to merit the rejection of any of our null hypotheses. We conducted this data analysis exclusively in Python, and we utilized existing packages, as documented in the ‘Materials’ section.
During our data analysis, we sought to identify significant differences in the summary statistics between the various stimuli categories.Our analysis methods generated a set of summary features for each image viewed. Our findings on participant’s responses to these stimuli sets and our summary of the importance of specific categories of biosensory data is documented in the ‘Results’ section of this report.
Results
Findings from eye-tracking data analysis
Using the Pupil Invisible, we were able to gather data on the quantity and length of gaze fixations and saccades of our participants when viewing the stimuli. We arrived at the following metrics which we used to process the raw data, which we believe will allow us to effectively evaluate the validity of our hypothesis:
Below are the processed Pupil Invisible results of our 6 participants:
![]()
Reviewing the visualization of fixations alone, we noticed a few trends that reflect how participants reacted differently to different stimuli categories.
For most of our participants, the total number of fixations increased in the two experimental groups as compared to the control group. However, this difference is marginal, and for several of our participants there was a decrease in fixations in the experimental groups. The biggest delta between either of the two experimental groups and the control group occurred during Participant 5’s recording, who had a 29% increase in fixations in the ‘Backstory’ group as compared to the control group. Participant 1 also experienced a 22% increase in fixations in the ‘Moniker’ group as compared to the control group. As for those who experienced a decrease in fixations in the experimental groups - both Participant 4 and Participant 6 experienced a 19% decrease in fixations in the ‘Backstory’ group. Beyond these few notable exceptions, the difference between control and experimental groups was within the bounds of -5% to +17%.
Our results on ‘Average Fixation Length’ were a slightly better indicator of there being differences in biofeedback to different anthropomorphized stimuli. While this metric speaks to more extreme differences between control and experimental groups, it shows extreme differences in both the positive and negative directions. Some of our participants had very dramatic increases in the length of their fixations in the experimental groups (such as Participant 4, who had a 65% increase in fixation length in the ‘Backstory’ category), while others had significant decreases in fixation length (such as Participant 5, who had a 25% decrease in the ‘Backstory’ category).
Both the ‘Total Fixations’ metric and the ‘Average Length of Fixation’ metric show that participants may react differently to different categories of anthropomorphization; however, reactions seen in these metrics are so inconsistent that it is difficult to parse any greater trend that spans across participants.
However, once we took a step back and considered the differences between fixations rather than flatting all fixations to a single category, we were able to parse some greater nuance from our datasets. We created a new sub-category of fixations called “long” fixations, which includes any fixation that is longer than 2 standard deviations above the participant’s average. We believe that this category is a reasonable facsimile of a participant’s ‘attention’ - the assumption behind this is that participants who are more engaged with their stimuli will hold eye contact with the stimulus for longer periods of time.
Distinguishing between fixation types revealed even more drastic differences between our experimental and control groups; but, these differences also seem to be dependent on the person, and like the other metrics, have very inconsistent directionality. For example, Participant 4 had a 200% increase in long fixations in the ‘Moniker’ group and a 700% increase in long fixations in the ‘Backstory’ group. But, Participant 1 had a 58% decrease in long fixations in the ‘Moniker’ group and a 36% decrease in the ‘Backstory’ group.
Our analysis of our participants’ saccades yielded similar results to our fixation analysis. While participants’ eye movements were slightly different in the experimental groups than in the control group, the directionality of that change was inconsistent, and the total amount of saccades was only marginally higher or lower.
Our eye-tracking results show that our participants do fixate in different ways to different types of anthropogenic stimuli. But, given our small sample size, and the differences in directionality of any changes that occurred between our control and experimental groups, we can’t say whether these changes in fixation habits are purely individualistic or if they speak to a greater trend that is applicable to humans at large.
Findings from EDA data analysis
The results for the EDA were limited to 6 participants, as the 7th participant had an issue where the device continued recording and due to the imprecise nature of the estimated start time for that individual, we were unable to determine when the start time for the stimuli was given the timed nature of the results, so this user was abandoned.
The below three plots show in Figure 3 the distribution of EDA mean and median values (normalized) for each period by the stimuli group they were shown. Our hope was to see an overall lower normalized EDA for the control group than for both the moniker and backstory. This does seem to be the case for the first participant and the fourth participant, however the general shape of the graphs remains the same and the scale does not shift significantly.
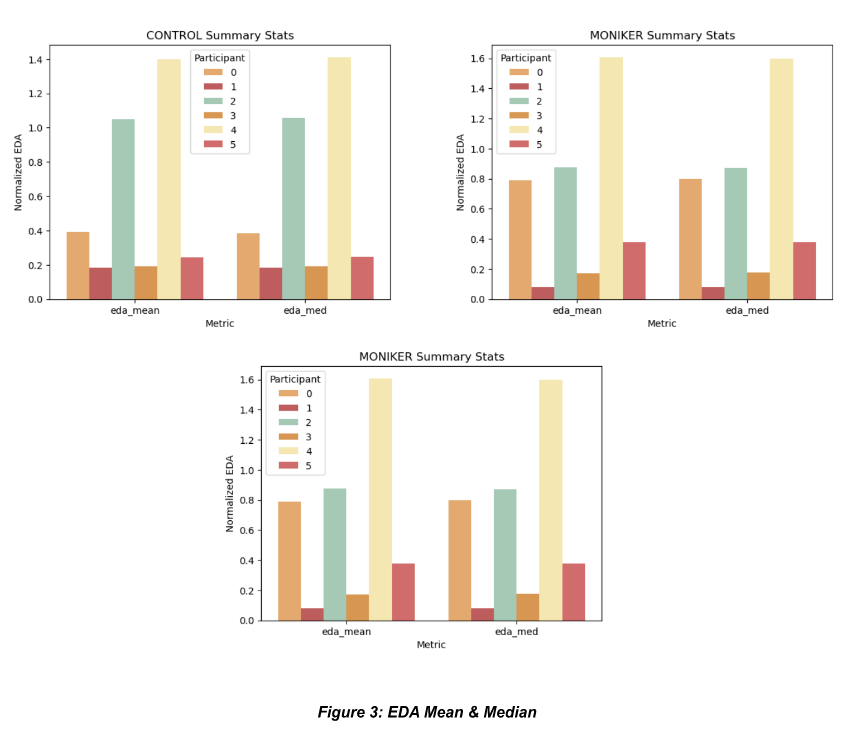
We dove into looking at the time series by category and were seeing similar results to those seen in the bar distribution above - nothing promising in terms of an overall depression or excitement of EDA for a given stimuli. Very clear from both plots is the fact that each participant seems to respond differently to different images, which is seen in the ups and downs in the rolling EDA within each stimuli time series (see research papaer for visualization) and in the different magnitudes of the bars in Figure 3. To control for different responses and feelings towards different stimuli (be it the pictures or the names or the audio) would need to be overcome by having so many recorded instances that a general trend begins to emerge as opposed to looking at only six participants.
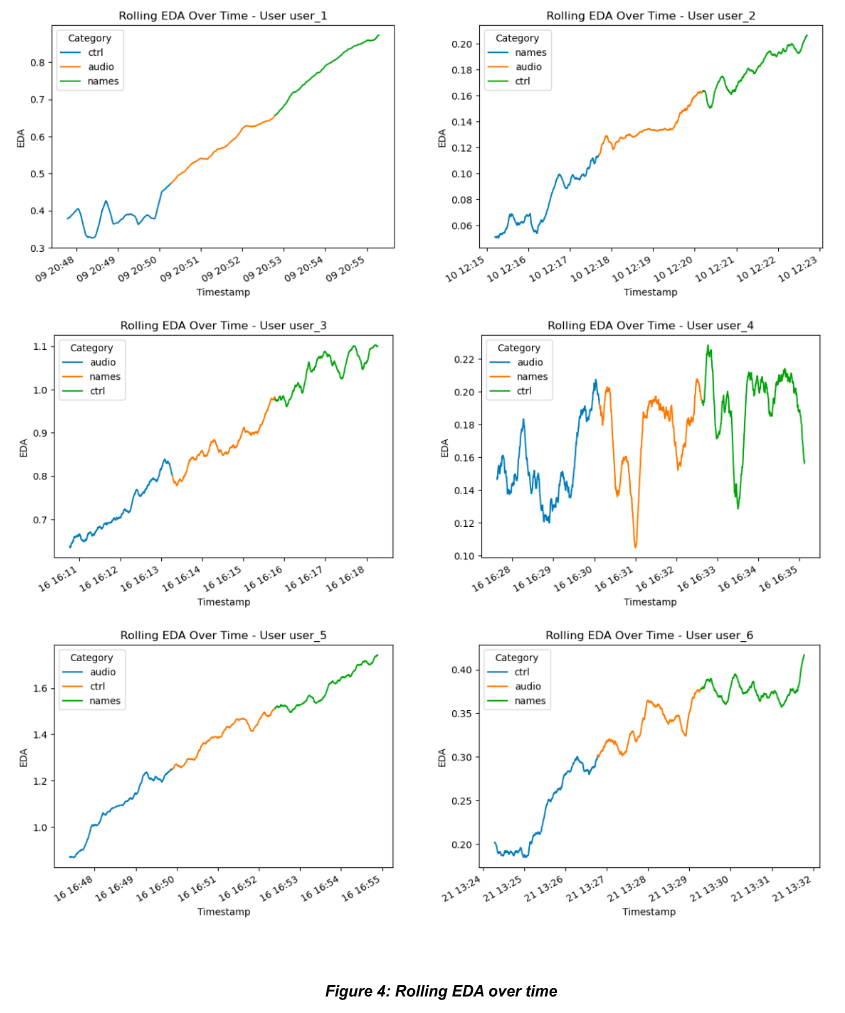
It was with these visualizations that we started to realize a trend that was concerning. When put in the order that the stimuli were presented, the time series represented an ever increasing EDA trend which can be seen clearly in Figure 4 below. Apart from user 4, who experienced the same experimental setup as user 3 apart from a brief interruption, the Embrace seems to take a while to ‘warm up’ which leads to a gradual increase in a user’s EDA reading over time the device is worn. The other possible interpretation of this result is that since each block is made up of variations on the same 15 images, the user’s ‘stimulation’ increases as they revisit images that they have become familiar with over time i.e. excitement increases with familiarity. The latter interpretation would need to be explored with repetition of the experiment allowing for different images through each category of stimuli or experimenting with a set-up where the user wears the sensor for a period of time prior to the introduction of the stimuli, completing a controlled activity (e.g. listening to music or meditating). Either way, the results show some response but the causal relationship is entirely inconclusive given the experimental design and number of users queried.
Finally, we rounded out our EDA analysis by conducting a resampling and decomposition. Resampling of the EDA data was needed due to the low sampling frequency of the EmbracePlus. By resampling, we were able to leverage the scipy.signal library and take a look at the decompositions to see if there was an overall trend in the tonic component of the signal amongst participants, which might indicate higher levels of arousal associated with a particular stimulus type. The results show similar findings to that seen in the general time series plots of the rolling normalized values. Our sample size is too small and the variance due each participants response to a stimulus group or specific image is too great to truly derive meaning from these results. In the future, this work would need to be completed with a much larger sample size to effectively tease out trends in behavior or response related to a particular grouping of stimuli.
Discussion
The biosensory analysis yielded several promising findings and insights, albeit with some challenges. There does appear to be some EDA response and artifacts within the analysis of saccades for the gaze tracking data, however the results are incredibly preliminary and suggest the need for a more controlled experiment run with many more users and highly controlled environs.
From the EDA data, we can see each user has a different response to the stimuli. This is likely due to differences in resonance of each image with each individual, in addition to interruptions during the sampling. This is promising and could potentially be handled with future work to normalize metrics by subsampling by each individual image, however this would have taken significant set up and analysis time that was not available to our group.
The gaze data from this study opens up several fascinating areas for discussion. Firstly, it challenges pre-existing notions about how multimedia elements, specifically the combination of images, text, and audio, impact visual attention. Interestingly, the length of fixations remained relatively consistent across participants, with only one exception. This uniformity challenges the assumption that images accompanied by text and audio would inherently lead to shorter fixation durations compared to standard slides. Instead, our data implies that the presence of text does not significantly alter the duration of visual attention. Additionally, the presence of an outlier in the data highlights the importance of individual differences in information processing, suggesting a potential for more personalized content delivery based on each person's unique processing style. Secondly, the finding that Moniker and Backstory categories showed an increase in saccades suggests that the type of content can influence eye movement patterns. This opens up a discussion on how different content types, like narratives or personal stories (as in the Backstory category), might prompt viewers to explore visual information differently compared to more standard or controlled content. Understanding that certain content types do not drastically change saccade patterns could influence how information is laid out visually to optimize viewer engagement and information intake.The results could spark further research on cognitive load and attention. Specifically, it would be interesting to explore whether the increase in saccades in certain content types is due to increased cognitive engagement or simply a response to the layout and nature of the content.
Course
Info 290T. Biosensory Computing , Fall 2023