Open BCI Motor Imagery
Introduction
Our initial motivation is to allow the control of a third-person vehicle/avatar in a 3D environment using solely brain signals and imagined movements. Such work has been done before to use BCI to play games ( ) and operate robotic systems. We are excited by the future potential of this Motor Imagery BCI to shape the future of Human-Computer Interaction and many critical issues in society such as assistive technology.
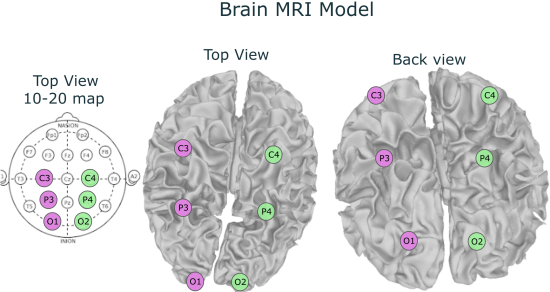
In this project we utilize a 8 channel EEG headset to develop a two category classifier of Left vs. Right based on motor imagery. The electrode placement was based on the 10-20 system utilizing the following positions: O1, O2, P3, P4, C3, C4, Cz, Fz. This setup was advised from the Open BCI Motor Imagery tutorial [1]. After we encountered obstacles using the Neuropype pipeline, we kept the same electrode placements when attempting to replicate the process of collecting training data for left and right (imagined vs. actual) arm movements for training a classifier. Despite not proceeding with training a classifier on the training data, the group explored the data produced by the electrodes
Methods
Motor Imagery Tutorial and Nueropype
We referenced the OpenBCI Motor Imagery Tutorial [1] to set up the Neuropype pipeline while aiming to build a 2-category (Left & Right) classifier. Our initial attempts were to replicate the study referenced in the documentation and to further apply these classifications for HCI tasks such as controlling an arduino based robot or translating the inputs into the control of a virtual avatar. During initial attempts, the group encountered errors when building the classifier. The error was a result of the pipeline's failure to develop Common Spatial Patterns (CSP) against the training data. When exploring the code it was found that the program responsible for collecting the training data was hardcoded to only accept signals from a single EEG channel. It was suspected that this is what was responsible for the failure to create CSPs on the training data when used against the live stream of EEG data. When altering the code and attempting to re-collect training data, we continued to run into the same error regarding the failure to apply CSPs against the training data. It is suspected that troubleshooting and fixing this error would allow for the application of left vs. right classifications using the Neuropype pipeline. Due to time constraints the group decided to instead replicate the first few steps of the pipeline and manually analyze the data that would serve as input for training data. The group’s primary hypothesis is that there are underlying, predictable, in the individual electrodes when performing left vs right, imagined and actual, tasks. Our goal is to model these trends and present them into an interpretable format for later exploration and attempts in developing a motor imagery-based classifier.
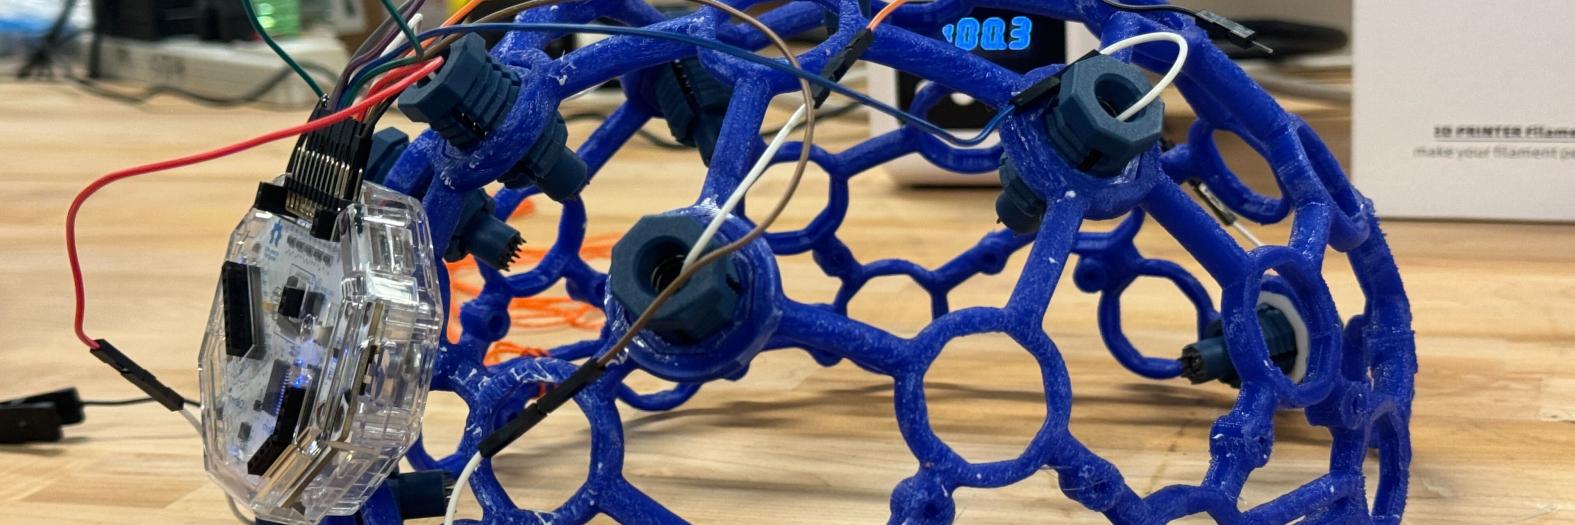
Due to fitment limitations of the 3D printed EEG frame, data was only collected on a single individual, hereby referenced as the subject. Code was written to display a randomized left or right stimulus on the screen which corresponded with the action taken by the subject. For the Actual task, the subject was asked to raise their left or right hand. For the imagined task, the subject was asked to imagine raising their left or right hand. In-between each task a brief rest period with no stimulus was displayed on the screen. The subject was requested to refrain from blinking when the stimulus is displayed and instead blink during these rest periods. Varying lengths of stimulus and rest times were tested, with the group ultimately deciding on 3 and 1 seconds respectively. Though in retrospect when analyzing, it may have been more beneficial to make both periods the same time for comparing rest vs action signals. Timestamps were captured corresponding to the start and end time of the stimulus as well as the rest period. These timestamps were later used in the analysis of the training data.
Great attention was given during the data collection period. In addition to refraining from blinking during the stimulus period. The subject was placed in an isolated, dark, room where the stimulus was the only thing that could be viewed by the subject. The subject was requested to fixate on the very center of the stimulus and to not avert their attention. All electronics were removed from the subject’s person and to not make contact with the desk. The subject was required to sit in an upright neutral position with their hands placed upon their thighs. When tasked during the Actual data collection, the subject was required to raise their hand with the same velocity and duration throughout the experiment, returning their hands to the same neutral position as before. These efforts were taken to reduce the introduction of artifacts into the training data for later analysis.
Iterated Objectives & Protocol
To move forward, we iterated our project objectives to build our own Left & Right randomizer for data collection.
Data Collection
Participants were asked to avoid eye blinks during each task to minimize noise. External factors including electronic devices and environmental noise were also avoided to ensure a reliable data collection for the experiment. Participants needed to perform actual and imagined arm gestures or rest accordingly by following the commands that appeared on the laptop screen. The total number of trials for both real and imagined gestures were set to 100 sets.
For the data collection we used 3D printed headset and Open BCI. We conducted the experiments in a dark and isolated room with minimal distractions from the environment. Additionally, we kept any electronic devices away to avoid interference with the device. During the data collection, our participant was guided to minimize blinking.
Software: We collected 100 sets of data from Tyler (as the headset only fitted him best) doing real and imagined gestures using the randomizer we built. Tyler performed 53 left trails and 47 right trails for imagined gestures, and 49 left trails and 51 right trails for actual gestures.
Analysis
The format of the data collected was converted from unix to standard and matched with the timestamps of each left and right trail. We reorganized the datasets and mapped them from power to frequency domain. We were able to get the power spectrum density (PSD) graphs for our data.
Are there significant differences and recurring signal patterns in the selected electrodes during left vs right tasks?
Could a left vs. right neural network based classifier be trained on raw EEG voltage readings without the need for further processing
Average power levels across electrodes for select bands (Alpha & beta) :
Imagined (Left Hand Task):
|
Channel |
Whole Band |
% of Band |
Alpha Band (8-13hz) |
% of Band |
Beta Band (14-30hz) |
% of Band |
|
O1 |
708.8 |
11.89% |
8.9 |
8.03% |
72.0 |
29.51% |
|
O2 |
1123.4 |
18.85% |
22.5 |
20.33% |
47.7 |
19.55% |
|
P3 |
2060.3 |
34.57% |
34.7 |
31.35% |
33.6 |
13.77% |
|
P4 |
605.8 |
10.16% |
16.7 |
15.09% |
33.5 |
13.73% |
|
C3 |
780.3 |
13.10% |
10.1 |
9.12% |
25.0 |
10.25% |
|
C4 |
682.0 |
11.44% |
17.8 |
`16.08% |
32.2 |
13.20% |
Imagined (Right Hand Task):
|
Channel |
Whole Band |
Alpha Band (8-13hz) |
Beta Band (14-30hz) |
|||
|
O1 |
573.9 |
11.23% |
8.2 |
8.17% |
79.4 |
34.90% |
|
O2 |
1044.9 |
20.44% |
22.1 |
22.01% |
48.6 |
21.36% |
|
P3 |
2041.7 |
39.94% |
36.9 |
36.75% |
33.2 |
14.59% |
|
P4 |
574.3 |
11.23% |
15.1 |
15.04% |
32.6 |
14.33% |
|
C3 |
482.3 |
9.43% |
8.0 |
7.97% |
15.0 |
6.59% |
|
C4 |
394.8 |
7.72% |
10.1 |
10.06% |
18.7 |
8.22% |
Actual (Left Hand Task):
|
Channel |
Whole Band |
Alpha Band (8-13hz) |
Beta Band (14-30hz) |
|||
|
O1 |
807.4 |
10.12% |
19.5 |
16.43% |
110.4 |
42.79% |
|
O2 |
1273.6 |
15.96% |
27.8 |
23.42% |
50.6 |
19.61% |
|
P3 |
672.6 |
8.43% |
14.8 |
12.47% |
24.9 |
9.65% |
|
P4 |
3795.3 |
47.55% |
31.4 |
26.53% |
39.0 |
15.11% |
|
C3 |
692.9 |
8.68% |
10.7 |
9.01% |
13.8 |
5.35% |
|
C4 |
739.3 |
9.26% |
14.5 |
12.22% |
19.3 |
7.48% |
Actual (Right Hand Task):
|
Channel |
Whole Band |
Alpha Band (8-13hz) |
Beta Band (14-30hz) |
|||
|
O1 |
998.8 |
11.52% |
19.2 |
13.61% |
120.8 |
42.48% |
|
O2 |
1700.6 |
19.61% |
33.3 |
23.62% |
57.8 |
20.32% |
|
P3 |
805.4 |
9.29% |
16.4 |
11.63% |
26.2 |
9.21% |
|
P4 |
3626.0 |
41.82% |
39.4 |
27.94% |
41.6 |
14.63% |
|
C3 |
562.8 |
6.49% |
13.0 |
9.22% |
14.9 |
5.24% |
|
C4 |
976.6 |
11.26% |
19.7 |
13.97% |
23.1 |
8.12% |
Interpretation of Findings and Data Visualization
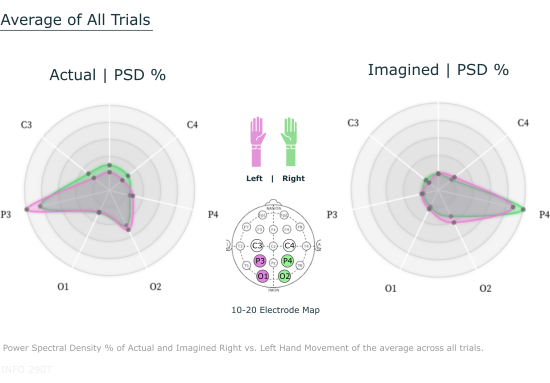
As is shown in the tables above, the power levels of P3 across the whole band is significantly higher in imagined gestures than in actual gestures for both left and right hand tasks. P4’s power level across the whole band is significantly lower in imagined gestures than the actual for both left and right hand tasks. For the alpha band, the power level of P3 in imagined gestures is significantly higher than the actual, whereas the power level of P4 in imagined gestures is significantly lower than that in the actual. There is no significant power level difference for the beta band in P3 and P4 electros. This might be due to ???
The power level of C3 and C4 in the beta band is significantly higher in left than in right hand tasks in imagined gestures. In actual gestures, however, there is no big difference in power level of C3 and C4 in the beta band between left and right. This might be due to external factors during our data collection proces ???
It would be worth further exploring the P3 and P4 electrodes, or placing additional electrodes across the parietal lobe when attempting to collect usable data for developing a left vs. right motor imagery classifier.
Obstacles and Learnings
Nature of obstacles
Obstacles we encountered include managing the massive dataset, technical difficulties in translating the data into insightful visualizations, and the irreplicable data collection steps.
What we wished to achieve yet did not get to
We wished to create our own 2-category classifier of left and right gestures so that we could apply it in multiple fields such as controlling robots or video game avatars.
Running a multivariate regression analysis of individual electrode power readings for left vs. right
Ideal Result: Mind Controlled Game: Motor Imagery classification using HTM, Cloudbrain, and the OpenBCI
Future Work
Technical: Beyond Right and Left
- Expand data collection
- Build our own classifiers
- gesture prediction
- Use the pipeline to control robots and video game avatars
- Start with left/right
- Expand to more directions / body movements
Conceptual: The future of Brain-controlled Interfaces
- Control robots / avatar
- Explore more body movements
- Explore how imagined input is affected by distractions
- Explore the patterns differences across different users
Project Artifacts
- Code for Collecting Training Data
- Code for Analyzing Training Data
- Radar Chart https://observablehq.com/d/4dae7abca48c5d5d
References
[2] OpenBCI Ultracortex Open Source
[2] Deep Learning for EEG Classification Tasks: A Review (2019)


