Assessing the Predictive Power of Earnings Call Transcripts on Next-Day Stock Price Movement: A Semantic Analysis Using Large Language Models
Abstract
Earnings calls are important for investors because they provide insights into a company's financial health and future outlook. However, interpreting the sentiment from these calls and the related impact on stock prices is challenging. This paper investigates whether semantic analysis of earnings call transcript content can be used to predict the next-day stock price movement relative to the NASDAQ index. We analyzed over 1,900 transcripts from the top 50 companies in the NASDAQ index. We generated categorical features from the semantic content using the GPT 3.5 Turbo model as an alternative approach. The analysis used KNN, BERT, and Longformer as standalone models and subsequently assessed Neural Net and XGBoost meta models. The models were evaluated using a weighted F1 score and benchmarked against a baseline using a majority class prediction of 61.2% accuracy and a weighted F1 score of 46.0% for the test set. The Longformer model performed best, with an accuracy of 58.0% and a weighted F1 score of 53.0%. While the model did not significantly outperform the baseline, it highlights the value of integrating qualitative insights with traditional quantitative analysis in financial analytics. We conclude that while earning call transcripts contain important semantic information, the stock market has many variables that can affect the price movement. Using less powerful Large Language Models and the earning call transcript alone, we can not predict the next-day stock market reaction with a high degree of accuracy. The study emphasizes the need for further research using more powerful models and an expanded dataset to help better capture the multifaceted nature of market dynamics.
- Introduction
Earnings calls are important investor events because they provide a direct channel to understand a company's performance and strategic direction from the top management. While financial reports provide data and figures, earnings calls provide rich semantic content—tone, sentiment, and choice of language—that can offer valuable insights into management's confidence and market expectations. This qualitative information is important as it can reflect underlying strengths or concerns not immediately apparent in numerical data alone and can thus hold predictive power. This paper explores the hypothesis: "Can semantic analysis of earnings call transcripts provide a reliable indicator for next-day stock price movements relative to the NASDAQ index?" 1
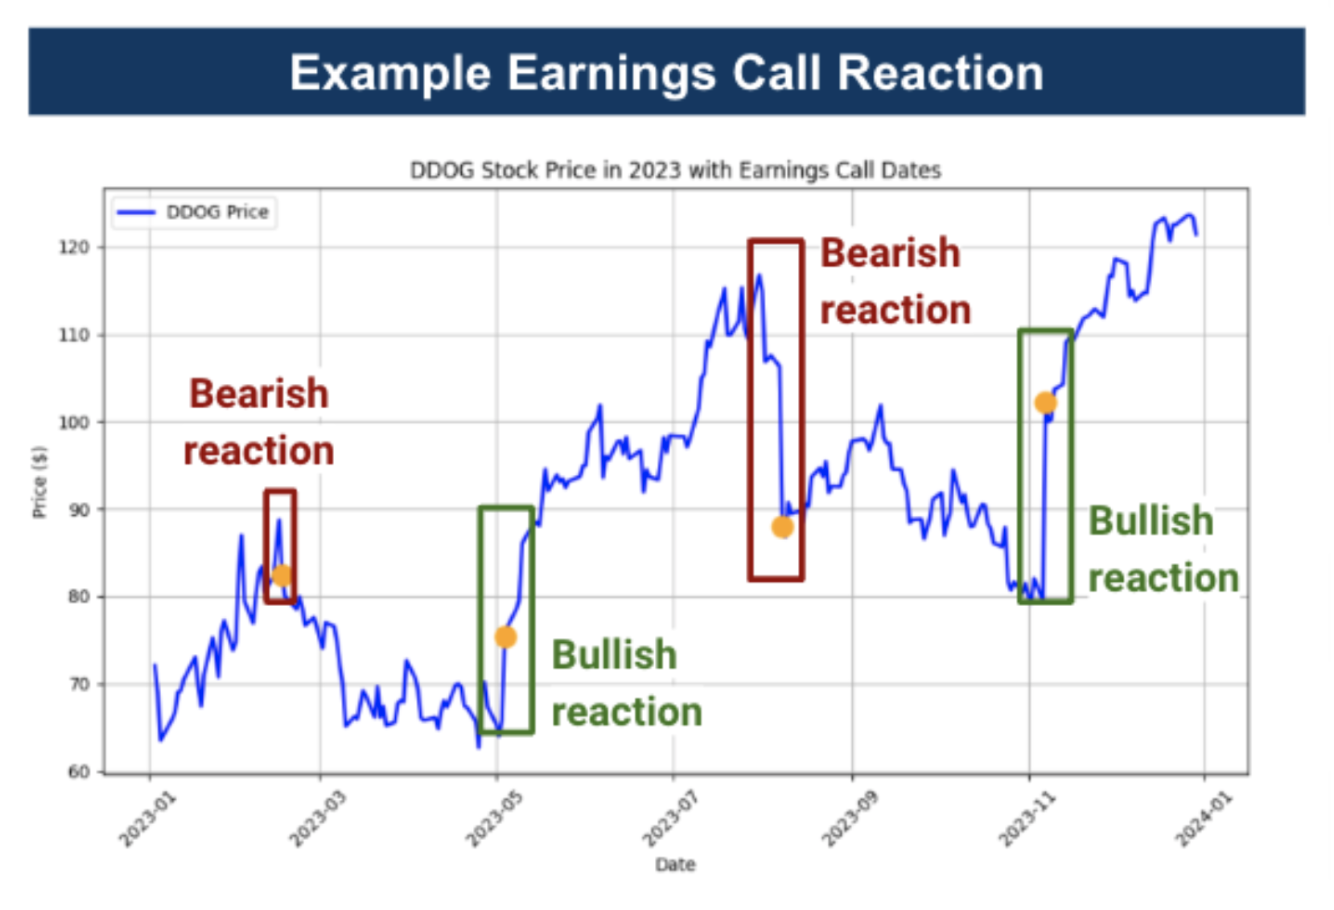
The importance of earnings calls extends beyond simple data dissemination. They serve as a platform for senior management to articulate their vision, address investor concerns, and set future expectations. How executives discuss financial outcomes, answer questions, and convey their strategies can significantly influence investor perception and decision-making. The immediate impact of these calls on stock prices is well-documented (Figure 1), with market reactions often attributed to the alignment or deviation of reported results from market expectations. However, the subtler semantic cues within these conversations are increasingly believed to play a crucial role in shaping investor sentiment and stock price movements.2
Figure 1: Stock Porce and Earnings Calls for DDOG
This study explores whether the qualitative semantic content of earnings calls could predict stock performance, potentially offering insights that surpass traditional quantitative analysis alone. We aim to uncover patterns and indicators that could signal impending stock movements by analyzing the language used during these calls. The findings can potentially enhance investment strategies, contribute to the broader field of financial analytics, and help influence the integration of qualitative data, which is still in its nascent stages.
- Literature Review
The interplay between earnings calls and stock market dynamics has been explored in financial analytics, with researchers using various computational approaches to capture this complex relationship. Our study builds upon the foundations laid by prior works in the field, aiming to leverage the capabilities of advanced Large Language Models (LLMs) like BERT and Logformer to improve the predictive insights gained from the semantic content of earnings calls.
- An Exploratory Study of Stock Price Movements from Earnings Calls2 presents a comprehensive analysis over a decade, encompassing approximately 100,000 transcripts from 6,300 public companies. This study's core findings highlight the limited correlation between analysts' recommendations and subsequent stock price movements post-earnings calls, underscoring the potential of semantic features in predicting stock performance. The study leveraged a graph neural network-based method (StockGNN) and integrated semantic features through Doc2Vec. This research underscores the superior predictive power of semantic analysis over traditional financial metrics like sales and EPS. The study used conventional graph neural network architectures rather than more sophisticated LLMs. Our goal is to address this gap by exploring advanced LLMs that could offer deeper semantic understanding and adaptability to the ever-evolving financial landscape.
- Analyzing Sentiment in Earnings Conference Calls Using LSTM3 leverages the LSTM model to parse sentiment in earnings calls' Q&A sessions, comparing its efficacy against standard machine learning approaches. While the LSTM model exhibited challenges, such as overfitting and handling long sequences, this study illustrates the potential of nuanced sentiment analysis in predicting stock movements. The shortcomings of LSTM in this context, particularly its struggle against simpler models and sequence management issues, point to the possibility of exploring more sophisticated LLMs. Our research aims to address these limitations by employing models designed to understand complex semantic structures more effectively, potentially offering more robust predictive capabilities.
- Towards Earnings Call and Stock Price Movement4 tackles the challenges in accurately correlating earnings call content with stock price movements. This study's struggles with accuracy resonate with the broader challenges faced by the field, where traditional models often fall short in capturing the nuanced interplay between linguistic cues and market reactions. Our study is informed by these challenges, proposing the use of LLMs to capture better and interpret semantic information contained within earnings calls.
3. Methodology
3.1 Transcript Data
Our data consists of approximately 1,900 publicly available earnings call transcripts from Seeking Alpha, accessed via Rapid API. These transcripts represent the top 50 NASDAQ-listed companies, with the dataset commencing from the year 2016. The selection of companies from the NASDAQ index was strategic, given the index's representation of technology and growth sectors, often at the forefront of market movements and investor interest.
3.2 Data Preparation & Feature Engineering
3.2.1 Transcript Data
The following steps were undertaken to ensure a high-quality dataset conducive to effective model training and analysis:
- HTML Tag Removal: We stripped all HTML tags that could distort the semantic analysis.
- Transcript Segmentation: We split the transcript into the Presentation and Q&A sections.
- Named Entity Handling: We removed specific company names were replaced with the placeholder 'COMPANY', and individual names were anonymized with relevant titles, such as replacing 'Tim Cook' with 'CEO', to help the model's generalization capabilities.
- Disclaimer and Operator Exclusion: We removed non-informative sections such as disclaimers and operator comments where possible.
- Semantic Integrity: We retained punctuation and stop words because they play a significant role in the conveyance of semantic content.
3.2.2 Feature Engineering
Feature generation plays an important role in enriching our input data. The GPT 3.5 Turbo model was used to create short summaries of both the presentation and Q&A sections of the earnings call transcripts. This summarization serves a dual purpose. It distills the content into a condensed form that captures the essence of the call, allowing for a more efficient analysis. It also reduces the computational burden, which is beneficial when dealing with large datasets and complex models.4
We also leveraged GPT 3.5 Turbo to generate categorical features through an analytical and opinion-mining approach. This approach relied on prompt engineering—a process that involves crafting specific prompts to receive the desired output from the language model. We experimented with various prompts to obtain satisfactory responses that accurately reflect the semantic content of the transcripts.
To illustrate, we instructed the GPT 3.5 Turbo model to analyze the company's near-term financial outlook based on various factors, such as reported revenue, earnings growth, industry competition, and potential challenges. The model then categorizes the financial outlook into one of five categories: 'Very Positive,' 'Positive,' 'Neutral,' 'Negative,' or 'Very Negative,' along with a justification for its assessment.
Utilizing this method, the following categorical features were generated, each corresponding to different aspects of the earnings call:
- Risk Classification: Evaluate the level of risk as conveyed in the earnings call, considering both internal and external factors.
- Financial Performance Classification: Assesses the company's financial health and performance.
- Revenue and Profit Classification: Analyzes trends in revenue and profit, categorizing them into a standard classification.
- Management Tone and Guidance Classification: Gauges the tone of management and guidance for future performance.
- Sector and Product Performance Classification: Examines the company's standing within its sector and the performance of its products.
- R&D and Capital Expenditures Classification: Assesses the company's investment in research and development and capital expenditures, reflecting its growth strategy and innovation potential.
Integrating these categorical features was expected to improve the model's predictive capabilities by capturing the semantic context of the various dimensions contained in earnings calls. The importance of these features and their predictive impact will be discussed in later sections of this paper.
It is important to note that while we leveraged the GPT 3.5 Turbo model for summarization and categorical feature generation, these processes were not modeled or optimized separately in our study. Our primary focus was on assessing the efficacy of advanced language models in interpreting earnings call transcripts and predicting stock price movements. As such, summarization and feature generation served as a means of preparing the input data for our main analysis.
3.2.3 Stock Prices and Quantitative Information
In our study, the target variable the models aim to predict is the stock price change of a company following an earnings call. We used the Yahoo Finance API to acquire the necessary stock price information for individual companies and the NASDAQ index. We leveraged the following methodology to calculate the labels:
- Stock Price Change Calculation: The stock price change was computed as the percentage difference between the closing price on the day of the earnings call and the closing price the following day, using the following formula:
This metric quantifies the immediate impact of the earnings call and the financial information contained in the stock price. While we considered other periods, such as 7 and 30 days after the call, we believe that 1 day is the most relevant to the content of the company earnings call information as longer periods would risk the introduction of new information besides earnings call that could impact the company's stock price.
- Index Comparison: To account for broader market movements and isolate the company-specific reaction to the earnings call, we also calculated the NASDAQ index's price change for the same period. This step is important in helping to isolate market-wide trends from the company-specific performance.
- Excess Change Calculation: We calculated the excess stock price change relative to the NASDAQ index to capture the company-specific movement that the earnings call may have influenced. This is calculated by subtracting the index's percentage change from the company's percentage change, as illustrated below:
Excess Change (%) = Stock Price Change (%) − NASDAQ Change (%)
The excess change is a better indicator of the earnings call's impact because it filters out the 'noise' of overall market movements. Focusing only on the company's stock price change might provide misleading signals; a stock could appear to perform well simply because the overall market is up, or it could appear to perform poorly when the market is down, regardless of the earnings information. We can better attribute changes in stock price to the content of the earnings call by considering the company's performance relative to the index, which provides a more accurate label for our predictive models.
In addition to the stock prices, we calculated the 30-day stock process volatility and added the earnings surprise percentage. The usage and relevance of this information will be discussed further in this paper.
3.3 Label Strategy and Selection
We used a categorization approach for our labels, setting a percentage threshold to classify stock price changes as Bullish, Bearish, or Neutral relative to the NASDAQ index. This threshold strategy accommodates the volatile nature of stock prices and allows us to fine-tune the model better and more effectively. The selection process took into account:
- Volatility Management: Assessing varying thresholds allowed us to account for market fluctuations.
- Validation Measures: We used a separate validation dataset to identify the preferred threshold.
- Overfitting Concerns: Selecting a good threshold allows us to achieve a good training performance and generalize to unseen data.
- Economic Relevance: The selected threshold needs to offer practical financial implications, not just statistical improvements.
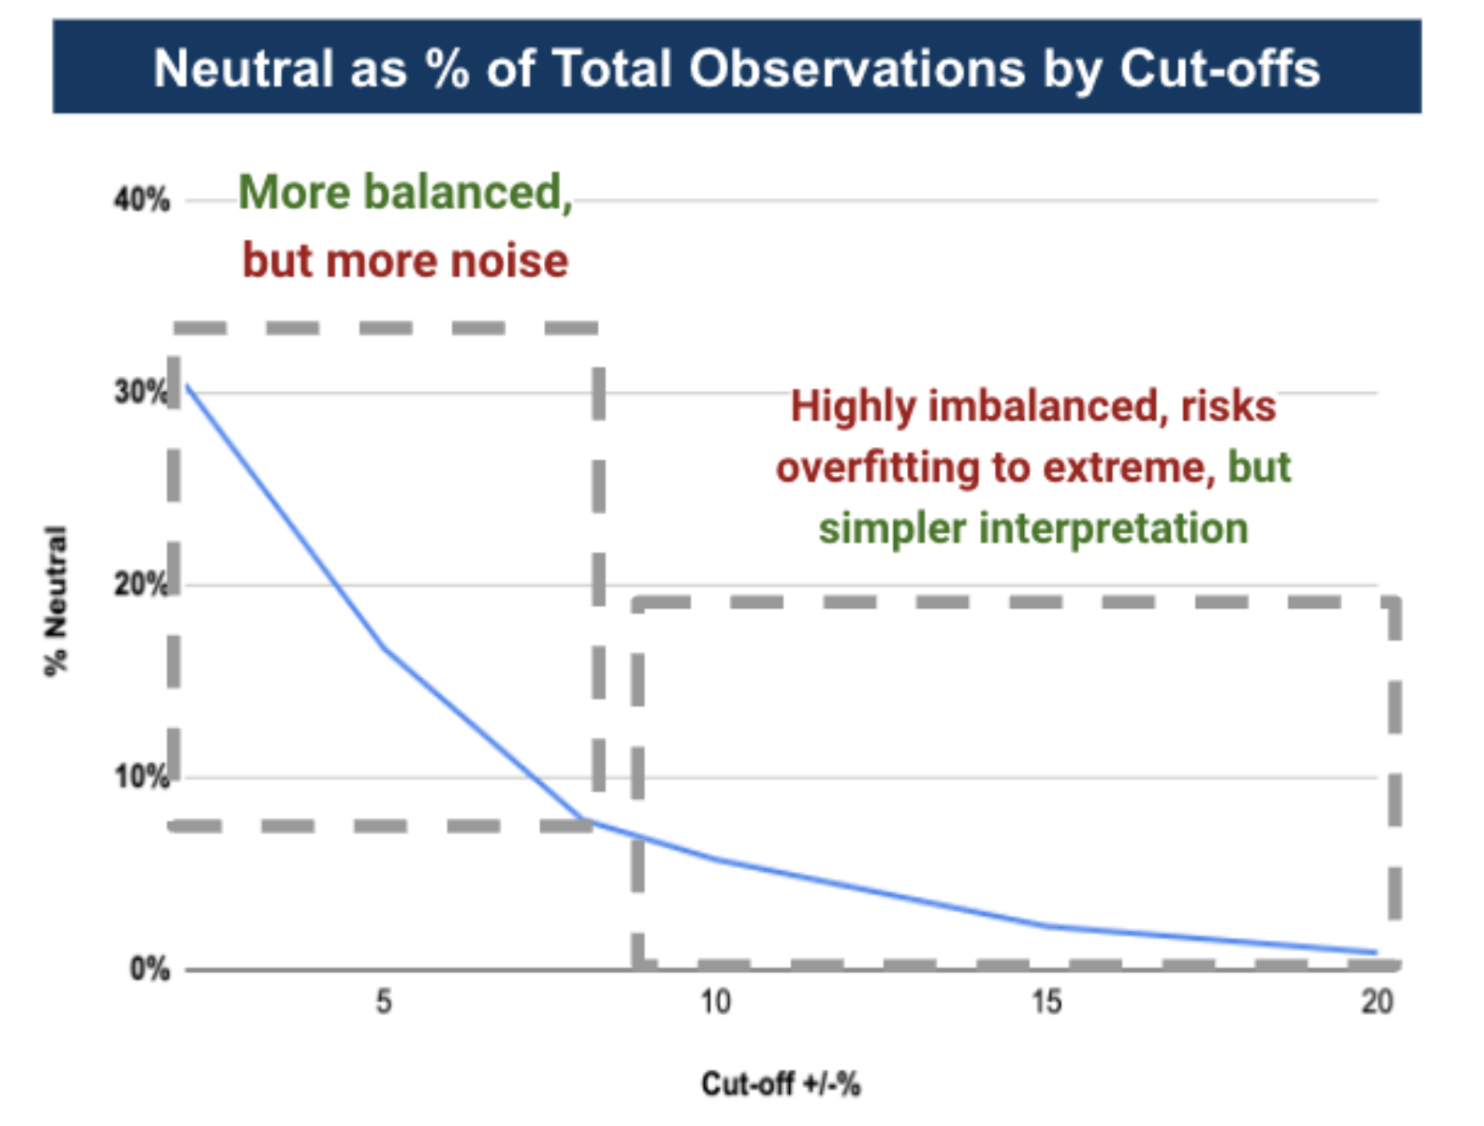
Figure 2: Threshold Selection Imbalance Trade-off
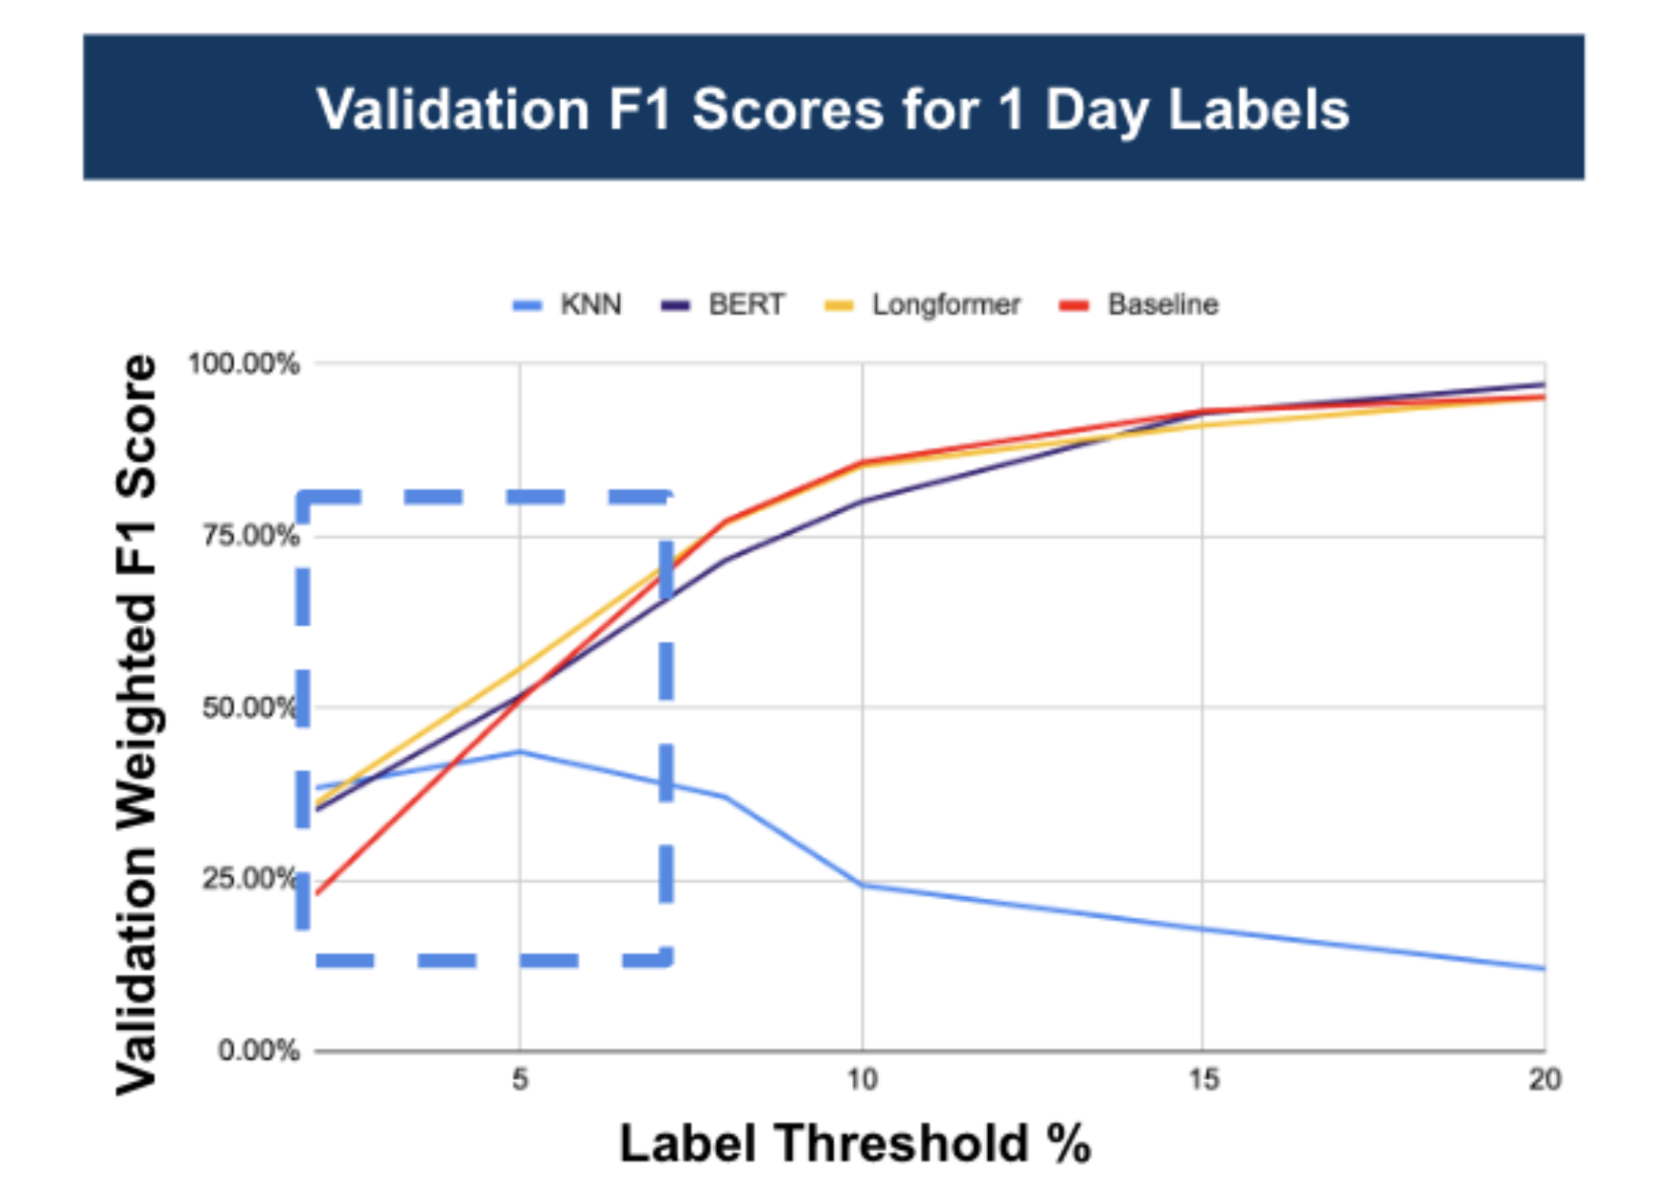
We leveraged the K-nearest neighbors (KNN) supervised model, BERT, and Longformer, all without hyperparameter tuning, to help us identify the most appropriate label threshold. The analysis pointed towards a label threshold selection within the 2-8% range (F igure 3) due to:
- Realistic Market Movement Capture: The chosen range captures significant market reactions.
- Dataset Balance: This allows us to balance data better, leading to a more robust training environment.
- Market Sensitivity: Allows the models to detect subtle shifts in the market attributable to the earnings calls.
- Downside: This range could introduce noise, as minor stock movements might still be treated as significant, and there is a potential increase in false positives/negatives.
Figure 3: Preferred Label Threshold Range
Based on our analysis, we selected a cut-off threshold of ±5% to balance between sensitivity to genuine market reactions and noise minimization. However, the data set is not balanced even with this selection, and we used an oversampling approach to produce a balanced training dataset.
4. Model and Features
Our methodology is organized into steps designed to build upon the insights from the previous one. Our model development steps are:
- Step 1: Prediction Using Presentation Transcripts: First, we focus on the predictive capacity derived from the presentation part of the earnings call transcripts. The rationale is that this section contains the core narrative of the company's performance and outlook, potentially containing valuable predictive signals.
- Step 2: Prediction Using Categorical Features: Next, we assess the model's performance when utilizing only the categorical features extracted by the GPT 3.5 Turbo model. We employ XGBoost with regularization and neural network models to assess the predictive power of these features.
- Step 3: Development of a Meta-Model with Categorical Features and Class Probabilities: A meta-model is deployed and uses the class probabilities from the the best-performing model from Step 1 and the categorical features from Step 2. The goal is to combine the probabilistic predictions with rich categorical data to enhance the predictive power of the metamodel.
- Step 4: Add Quantitative Features to the Meta-Model: In the final step, we enriched the meta-model with two additional quantitative features—30-day stock volatility and earnings surprise percentage—to complement categorical features and class probability predictions. This step aims to capture both the qualitative and quantitative aspects influencing stock price movements.
4.1 Evaluation Metric
Selecting an appropriate evaluation metric is crucial in classification tasks that use unbalanced datasets or where the classes do not hold equal importance. The weighted F1 score, a variant of the traditional F1 score, is well suited to the requirements of our study.
Given the multiple approaches and the nature of stock market data, particularly price movements following earnings calls, the distribution of classes is typically unbalanced. For instance, Neutral movements (minimal changes) might be more frequent than significant Bullish or Bearish shifts, especially when using a +/-5% threshold for categorization.
The cost of misclassification can vary significantly between classes. Misidentifying a Bearish signal as Neutral or Bullish could lead to substantial financial losses while confusing a Bullish signal might result in missed opportunities. As a result, it's important to use an evaluation metric that can account for class imbalance and reflect the varying importance of accurate predictions across different classes.
The F1 score balances precision (the proportion of true positive results in all positive predictions) and recall (the proportion of true positive results in all actual positives), providing a single metric to assess a model's accuracy. The traditional F1 score calculates this balance equally across all classes, which might not be suitable for our unevenly distributed classes where the misclassification cost varies.
The weighted F1 score extends the traditional F1 calculation by assigning weights to each class proportional to their representation in the dataset. This approach ensures that the performance in more frequently occurring classes contributes more to the overall score, making the metric more representative of the model's practical accuracy in predicting stock price movements.
We chose a weighted F1 score as our evaluation metric to balance the evaluation, reflect class importance, and offer comprehensive performance insights. It helps us align the practical realities and complexities of financial market analyses and ensures that our findings are robust and applicable to real-world trading strategies.
4.2 Modeling Approach
Step 1: Detailed Approach and Findings
For the first step, we used three models, a supervised KNN, BERT, and Longformer, with a baseline prediction model for comparison. The baseline model operates on the assumption of predicting the majority class every time, which gives us a reference point for performance assessment.
We chose BERT and Longformer because of their advanced capabilities in processing natural language. While BERT is known for its effectiveness in a wide range of NLP tasks, its token limit of 512 could truncate valuable context in longer documents. Longformer can process sequences up to 4,096 tokens, making it well-suited for long transcripts of earnings calls where maintaining context is crucial.
We analyzed the full presentations and their summarized versions to help assess Longformer's capabilities. This aimed to determine whether Longformer's extended token range would result in better performance and whether the performance would degrade when using summarized content.
Hyperparameters for each model were fine-tuned using the Weights & Biases (wandb) package and a Bayesian optimization approach over 30 runs, ensuring that each model operated under optimal configuration.
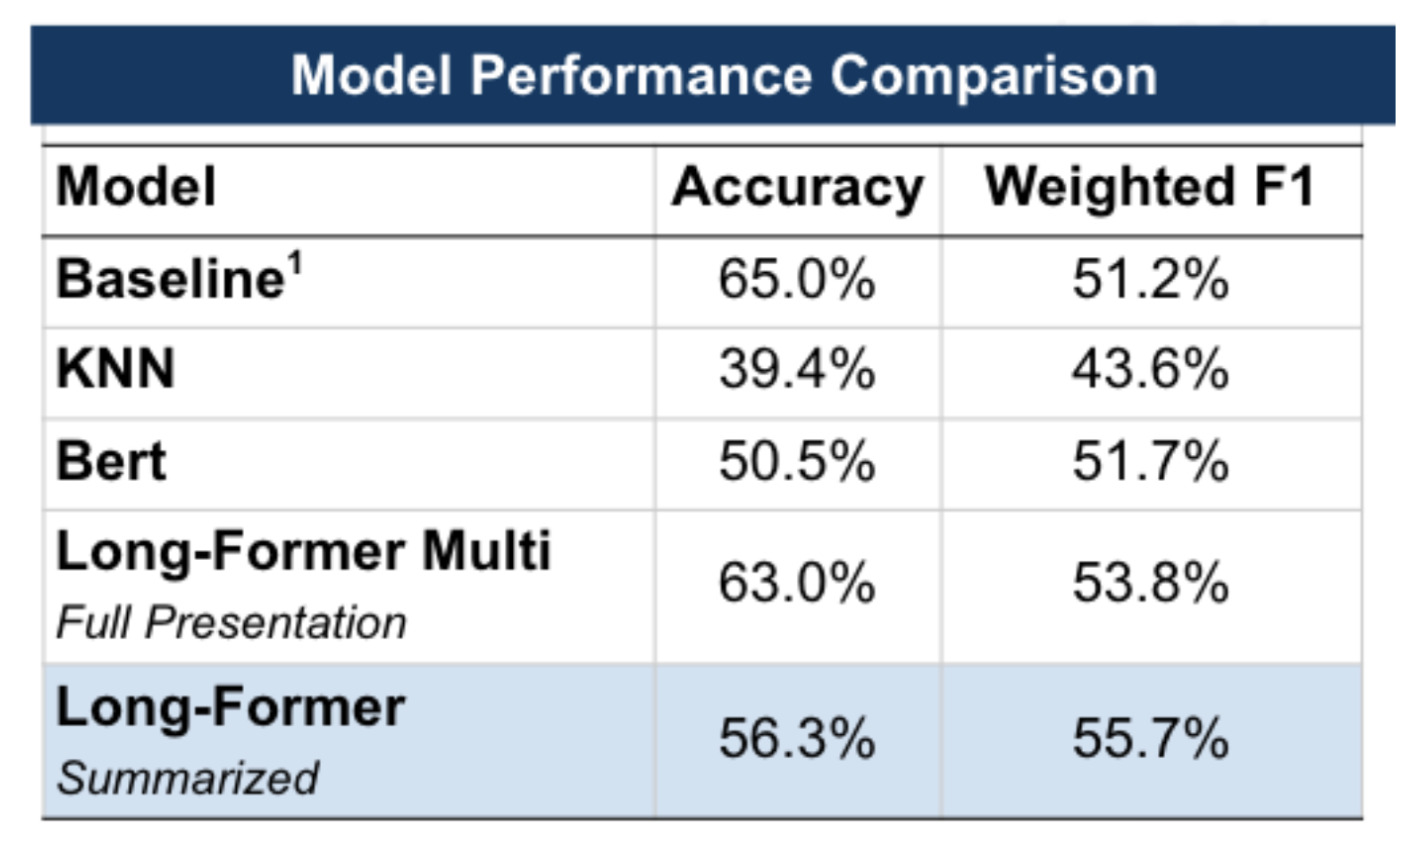
The Longformer model demonstrated a better balance between accuracy and the F1 score, outperforming BERT (Figure 4). Interestingly, we observed no significant performance degradation when using the summarized presentations as opposed to the full ones. This suggests that the GPT 3.5 Turbo model's summarization preserves the substantive content necessary for effective prediction, potentially offering a streamlined approach that conserves computational resources without sacrificing accuracy.
Figure 4: Step 1 Performance on Validation Data
We also explored a binary classification approach and our multiclass label approach. This method simplifies the model's output to two classes, Bullish and Bearish, using the ±5% threshold. The binary classification system is beneficial due to5:
- Simplicity: Reduces the complexity of the outcome to a binary decision.
- Decision-making: Corresponds directly with the practical buy/hold or sell/hold decisions that investors frequently make.
- Focus on Extremes: Focuses on detecting distinctly positive or negative market sentiments, which can be of particular interest to investors looking for strong signals in earnings calls.
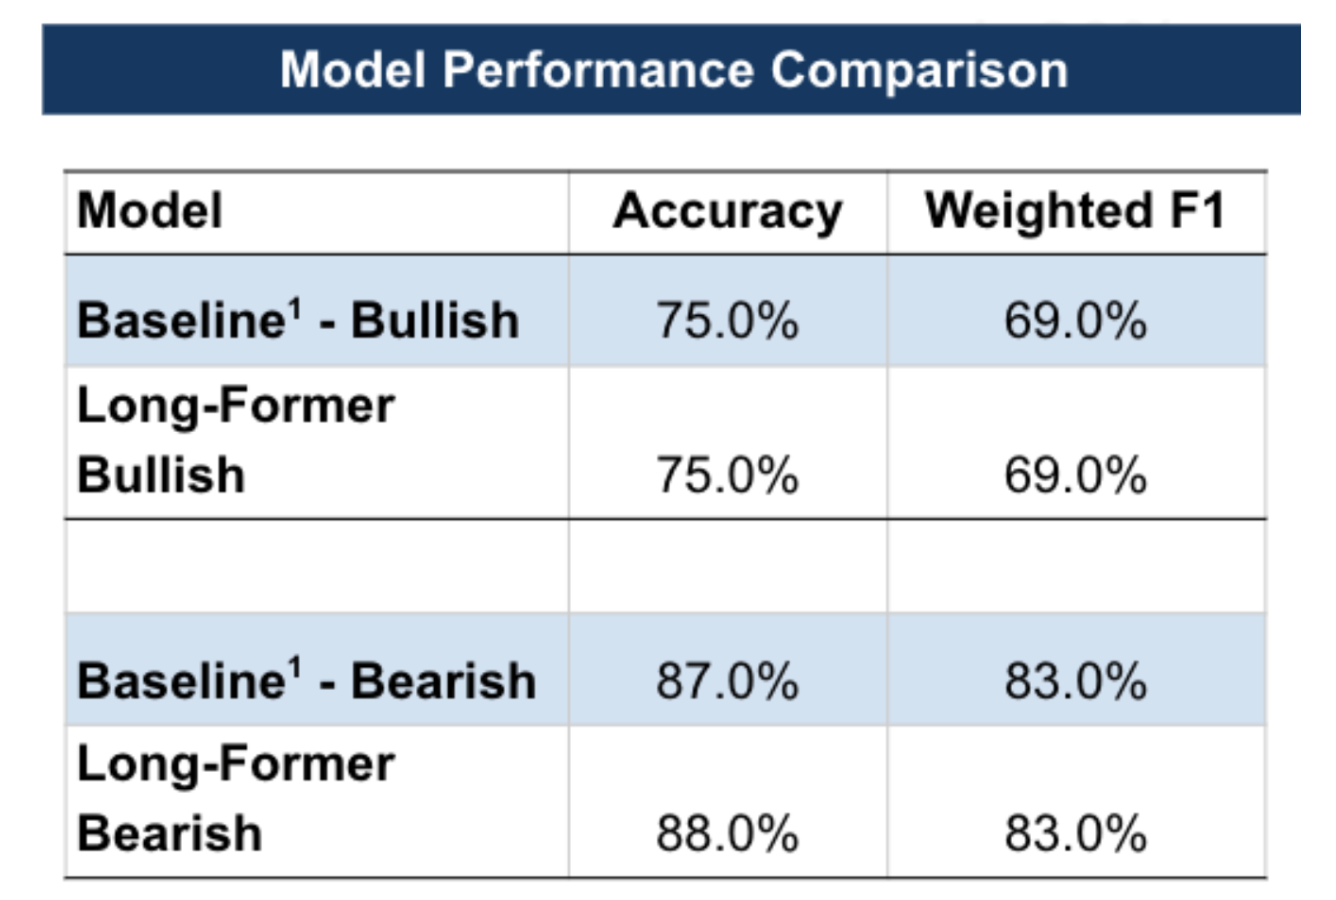
Our findings revealed that the Long-Former model, the best model from the multiclass approach, did not outperform the baseline in both binary approaches—Bullish/Non-Bullish and Bearish/Non-Bearish (Figure 5)
Figure 5: Binary Classification on Validation Data
The performance of the binary approach did not exceed the multiclass Long-Former model, suggesting that the multiclass model better captures the nuance of the market's reactions to earnings calls.
Step 2: Detailed Approach and Findings
In the second step of our modeling approach, we built a meta-model using only the categorical features extracted from earnings call transcripts. This approach aimed to assess the standalone predictive power of these features when removed from the textual content of the presentations.
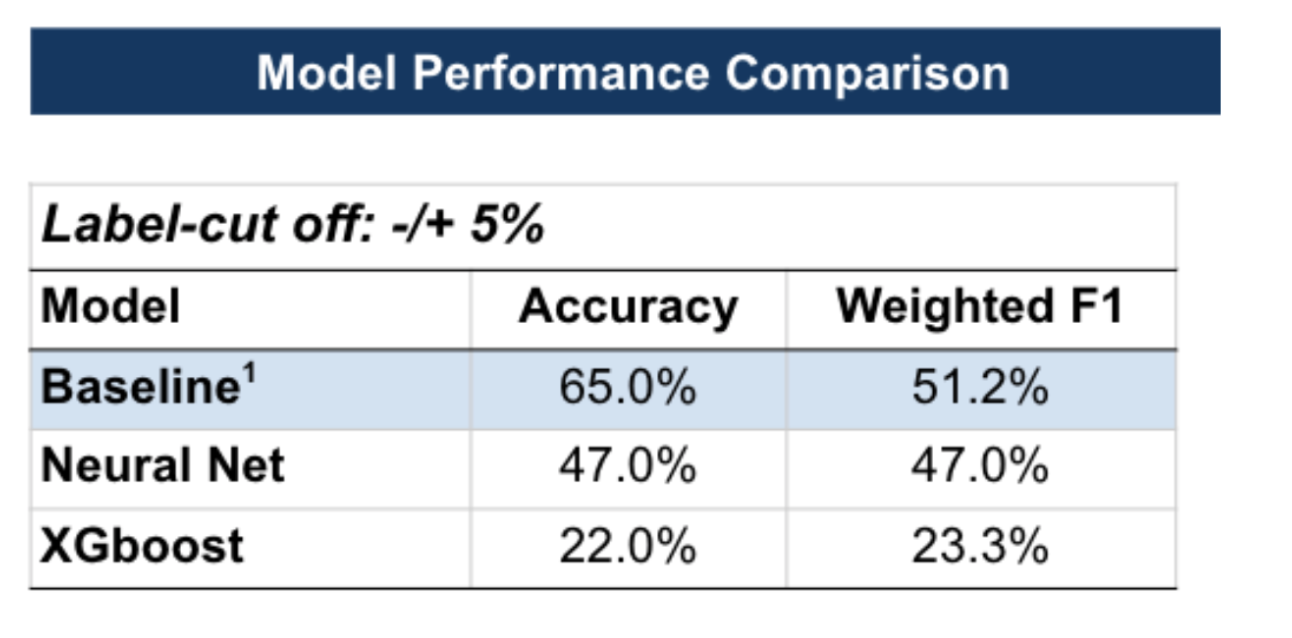
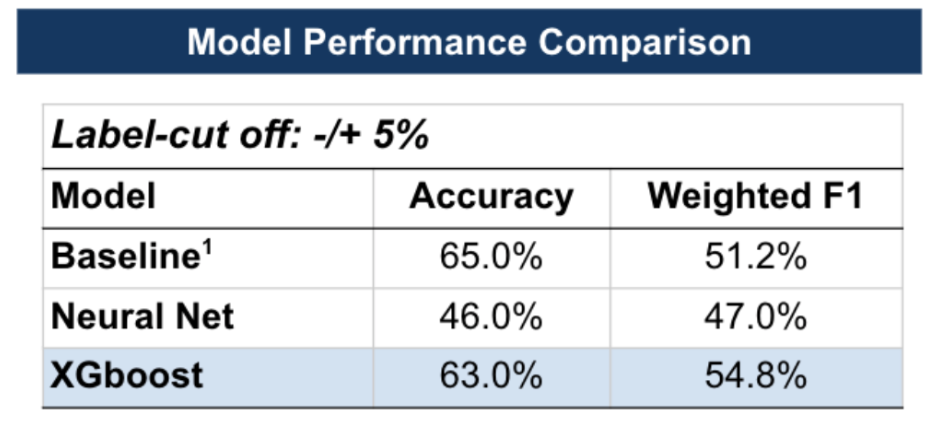
We leveraged two different models, a neural network and XGBoost, with regularization, and the performance of these models was compared to a baseline that always predicts the majority class. Our analysis indicates that the meta-model with extracted categorical features alone did not predict stock price movements post-earnings calls. Both neural network and XGBoost models underperformed relative to the baseline across accuracy and the weighted F1 score (Figure 6).
Figure 6: Models with Categorical Features Only
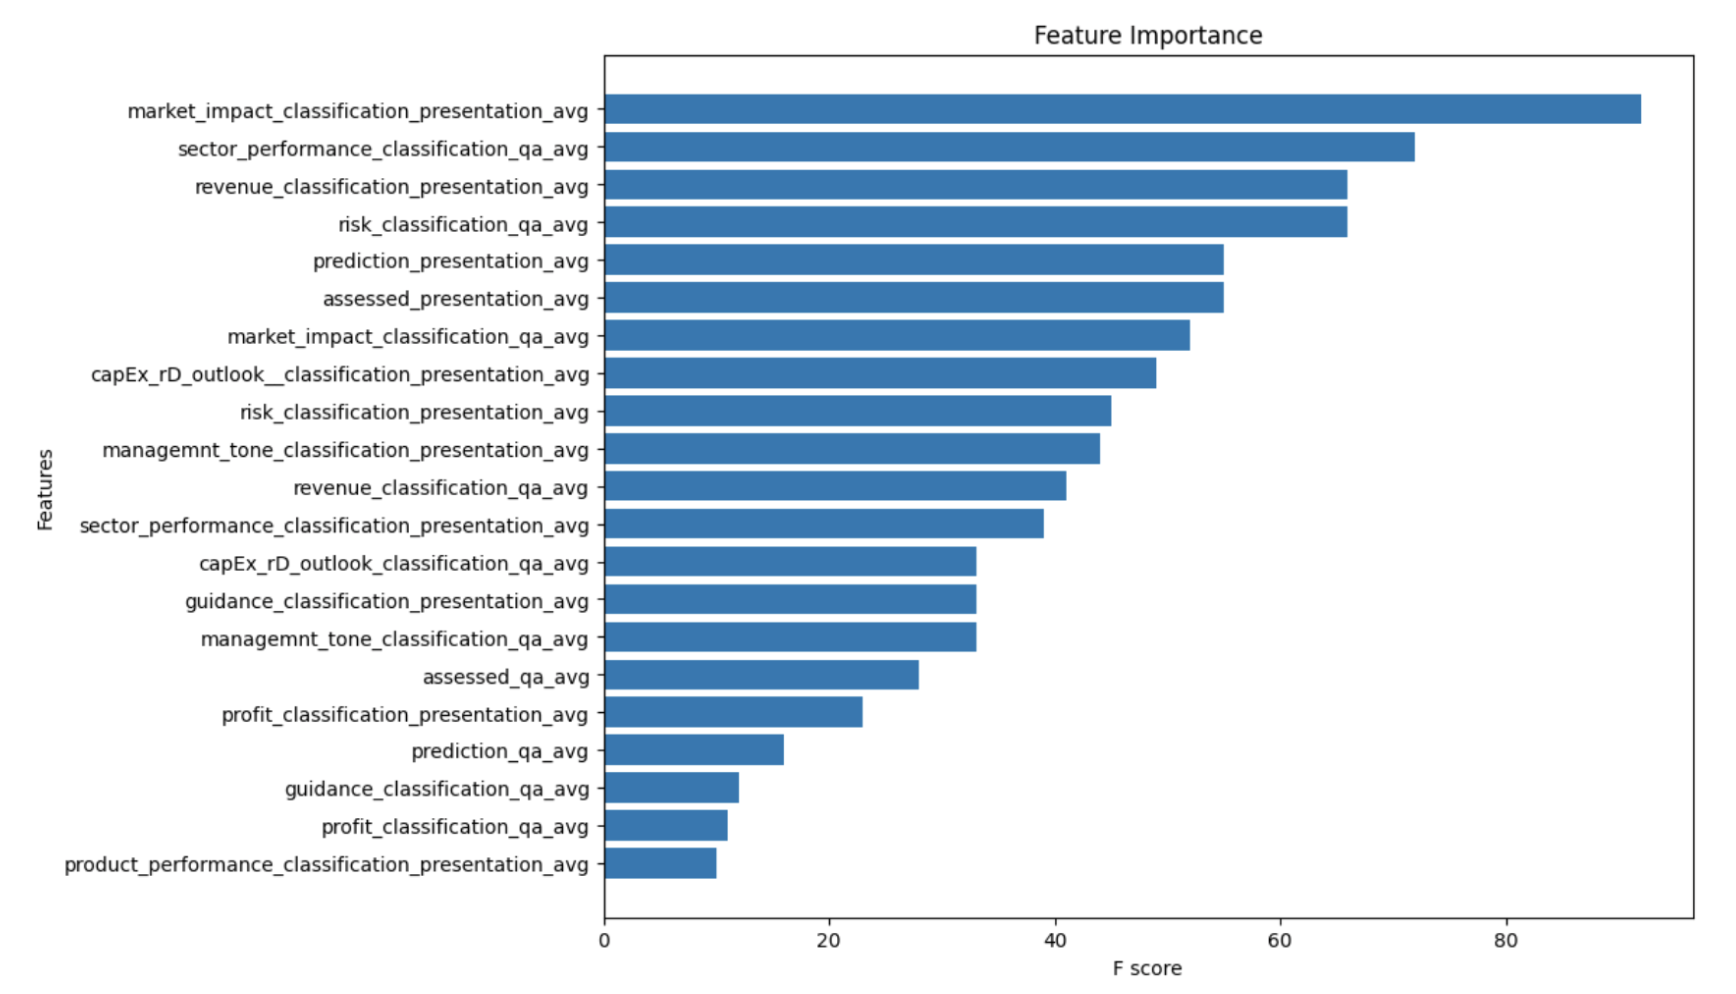
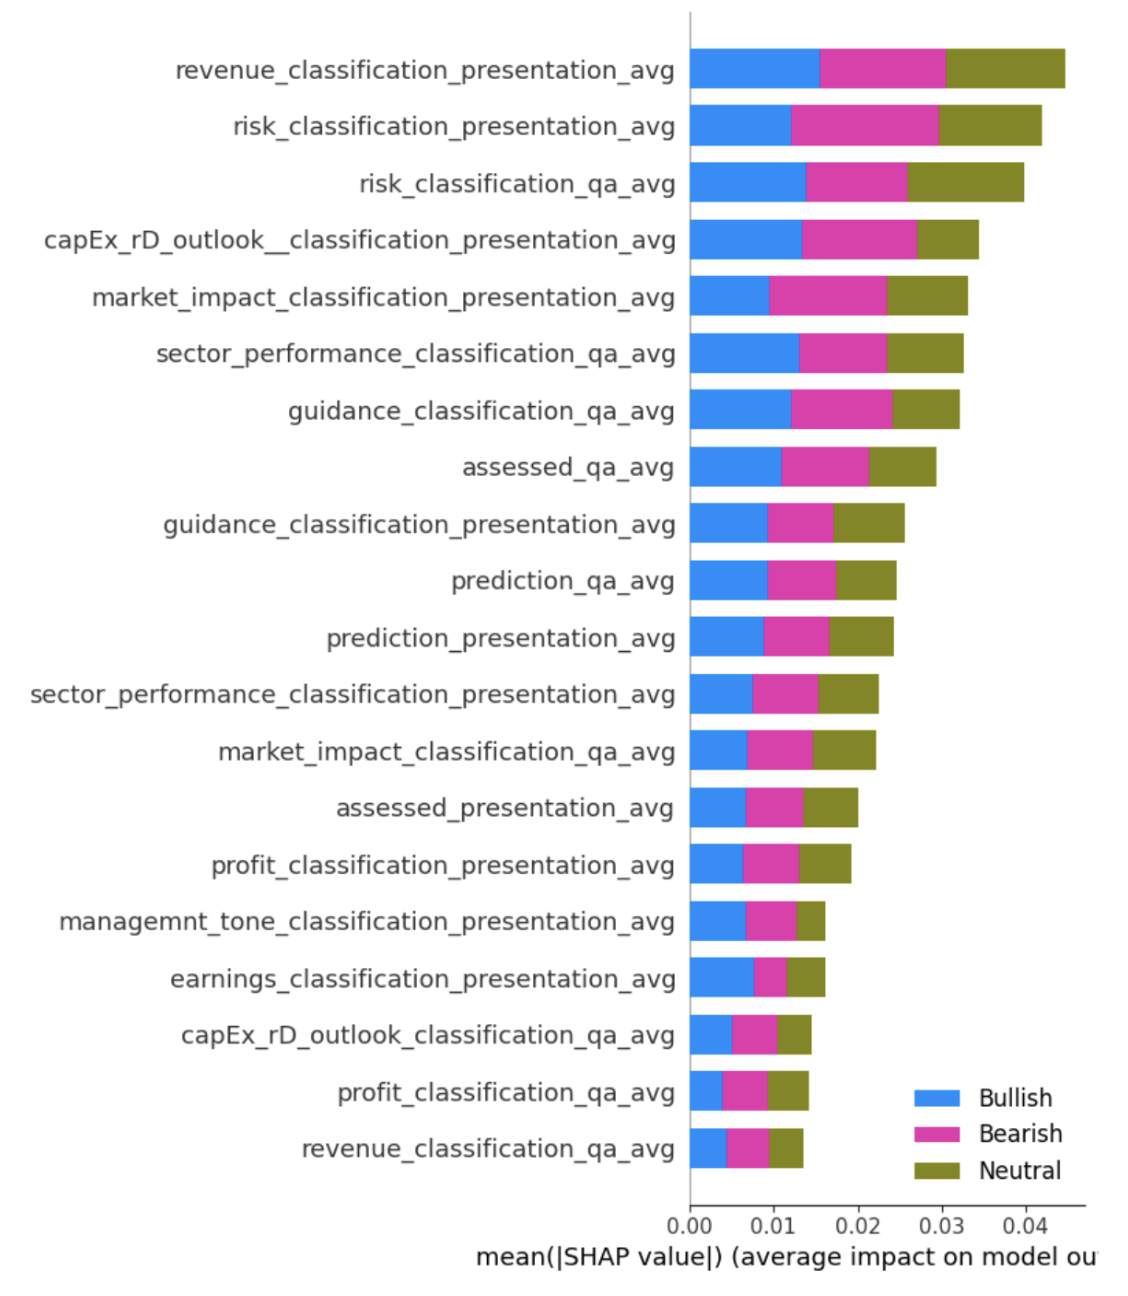
The provided charts illustrate the importance of the feature as determined by each model (Figures 7 and 8). In the case of the neural network, SHAP (SHapley Additive exPlanations) values were used to quantify the impact of each feature on model output. The features related to market impact, sector performance, and revenue classification, particularly from the presentation section of the earnings calls, were the most significant.
The disparity between feature importance and model performance raises critical questions regarding the sufficiency of categorical features for predictive accuracy. While certain features are deemed important within the model structure, their ability to predict stock price movements is limited when used in isolation.
Figure 7: XGBoost Feature Importance
These results suggest that while categorical features may carry informative signals, they may not be sufficient on their own to capture the complexity and nuance necessary for accurate stock movement predictions using our model.
Figure 8: Neural Network Feature Importance
Step 3: Detailed Approach and Findings
In Step 3 of our model development, we added the class probabilities derived from the most effective model in Step 1 to the categorical features. The goal of this step was to integrate the predictive insights with probabilistic outcomes to enhance the overall accuracy and F1 score of the model.
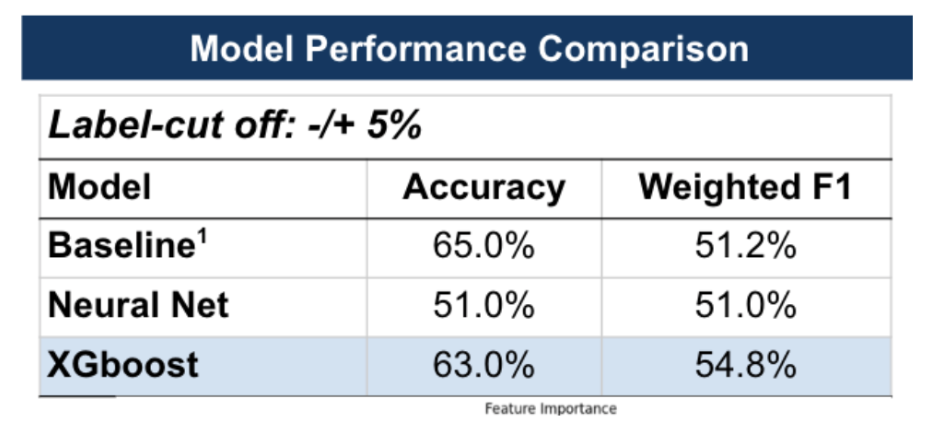
The XGBoost model's performance, in particular, improved significantly when compared to the Neural Net and closely matched the baseline's accuracy while surpassing it in terms of the weighted F1 score (Figure 9)
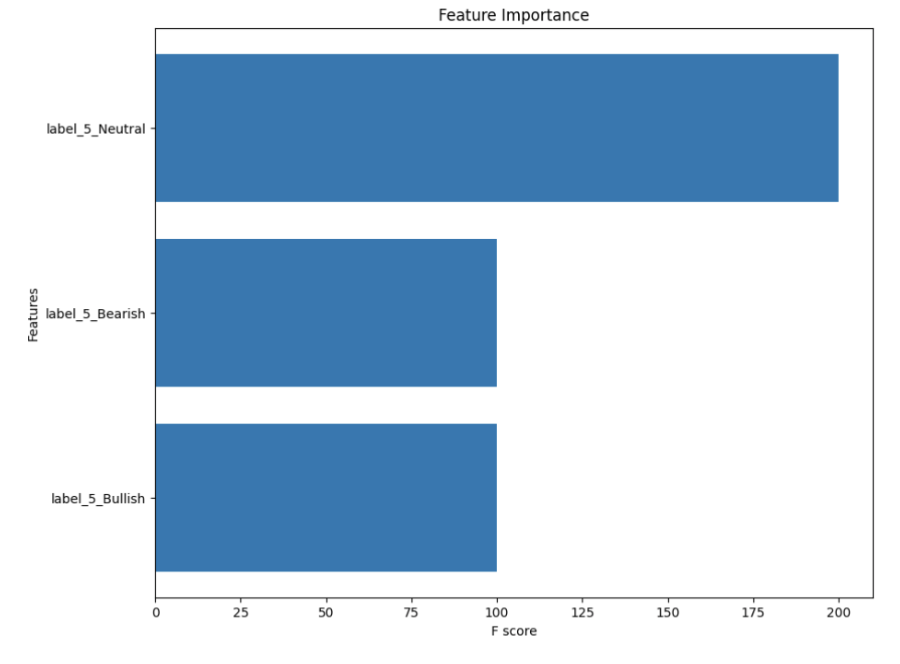
The feature importance chart for the XGBoost model shows that the model's predictive power was influenced only by the probability classes themselves (Figure 10).
Figure 10: XGBoost Feature Importance
This reduction in features to only the three probability classes indicates that the model is effectively leveraging only probability information, which correlates strongly with the true stock movement outcomes. The 'Neutral' class probability appears to be the most influential feature, indicating that the model may be particularly sensitive to identifying conditions that do not suggest a strong Bullish or Bearish movement, which indicates that the ability of the model to recognize the absence of strong sentiment (Neutral) is as crucial as identifying definitive sentiments (Bullish or Bearish).
Step 4: Detailed Approach and Findings
In the fourth step of our research, we examined whether incorporating the percentage of earnings surprise and the 30-day stock volatility as features could enhance the model's predictive capabilities. Two quantitative metrics were chosen:
- Earnings Surprise %: This metric reflects the degree to which the actual earnings deviate from consensus estimates. It is a critical indicator often closely monitored by investors, as surprises can lead to significant stock price movements due to the market's reaction to unexpected financial results.
- 30-Day Stock Volatility: This feature captures the extent of a stock's price fluctuations over the past month. Higher volatility can be an indicator of market uncertainty and may influence investor sentiment and risk assessment. The inclusion of this metric aims to provide the model with insight into the market's recent behavior toward a company's stock, which could impact post-earnings call reactions.
Our model was trained to evaluate whether the addition of these quantitative features would result in an improvement in performance over the semantic analysis alone.
The feature importance analysis from the XGBoost model showed a similar trend to that of Step 3, with the model prioritizing the three probability classes over the newly added quantitative features.
The inclusion of quantitative metrics did not exceed the performance metrics of the standalone Longformer, and the XGBoost model also regularized all features to probability predictions from the Longformer model. This suggests that, within the context of our study's focus on semantic content, the additional quantitative features did not provide substantial predictive value (Figure 11).
Figure 11: Categorical, Probability and Quantitative Features
These results suggest that while quantitative features are valuable, they did not materially impact the performance of the model in the context of this study. This could imply that the semantic aspects captured by the Longformer model, and represented through the probability predictions, already offer a substantial base for predicting stock price movements post-earnings call. However, it is important to note that this does not diminish the potential value of quantitative features in other contexts or combined with a broader set of variables.
5. Results and Model Insights
5.1 Model Perfornamce
After an evaluation involving a tiered modeling approach, we selected the Longformer model from Step 1 because of its superior performance. In assessing the model's efficacy on test data, we consider its predictive accuracy and its ability to understand the complex semantics of earnings call transcripts.
Compared to the baseline model, which predicts the majority class every time, the Longformer model exhibits a slightly lower accuracy but a higher weighted F1 score. The F1 score's improvement highlights the model's greater balance in precision and recall, particularly in the context of imbalanced classes (Figure 12).
Figure 12: Final Model with Test Data
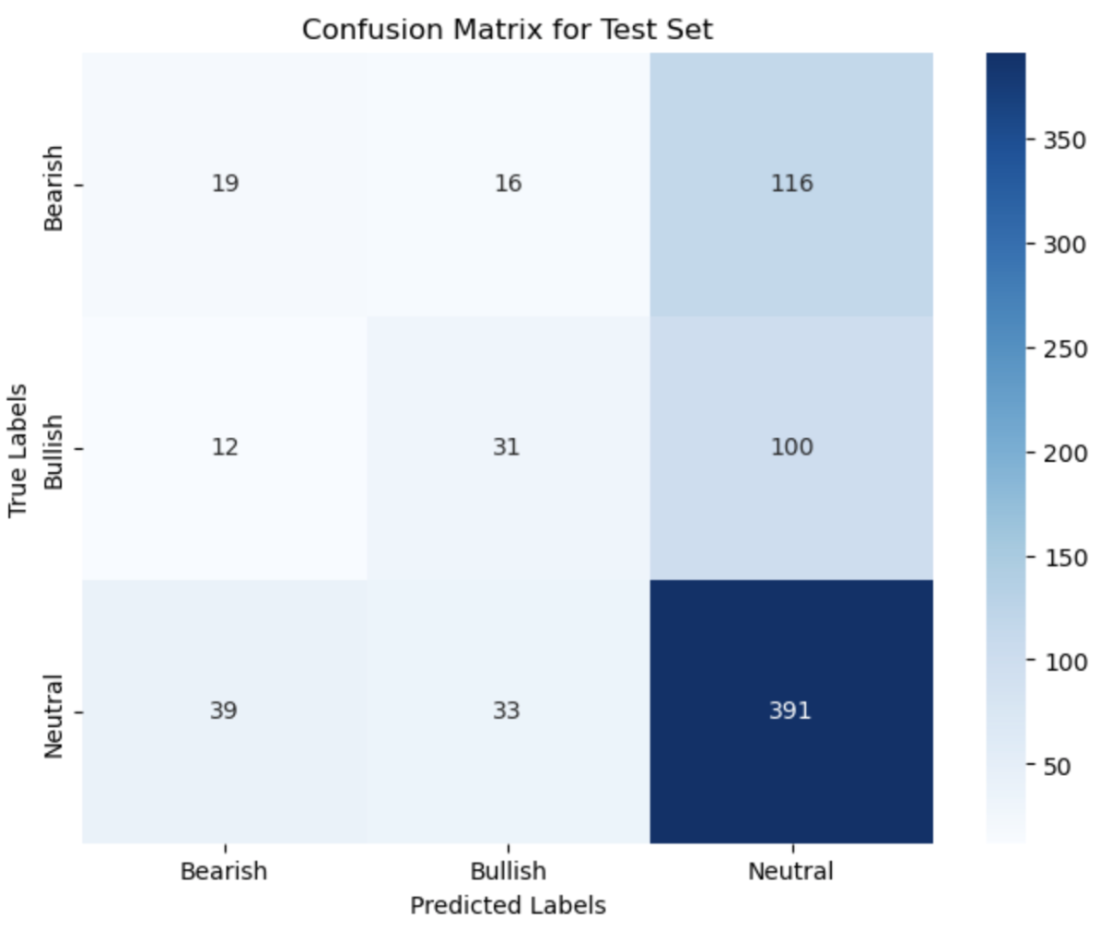
The confusion matrix for the Longformer model provides additional insights into its performance (Figure 13):
- High Neutral Predictions: The model shows a strong tendency to predict Neutral class as it t the majority class. This can be beneficial when avoiding false positives in more extreme categories, but may also lead to a high number of false negatives.
- Incorrect High-Confidence Predictions: There are instances where the Longformer model predicted Bearish or Bullish classes with high confidence but was incorrect, potentially due to:
- Misinterpretation of Tone: The subtleties of executive tone and intent during earnings calls can be challenging to interpret.
- Overemphasis on Specific Keywords: The model may overemphasize certain keywords associated with performance, such as 'growth' or 'decline', without capturing the overall context.
- Contextual Nuances: Complex financial concepts often involve nuanced language that can lead to misinterpretation, especially when discussing forecasts and future expectations.
- Ambiguity in Sentiment: Sentiment analysis is inherently challenging, and ambiguity in statements could result in high-confidence misclassifications.
Figure 13: Final Model Confusion Matrix
The Longformer model's capability to process longer sequences allows for a more contextual understanding of the earnings calls. However, the errors in high-confidence predictions suggest that while the model can capture extended context, it may still struggle with the intricate semantics involved in financial language. The subtleties of financial language can affect sentiment analysis and tone interpretation.
Despite these challenges, the Longformer model outperformed the baseline in F1 score, underscoring its potential in extracting meaningful patterns from data that a simple majority class predictor cannot. It suggests that while the model does not always achieve high accuracy, it provides a more nuanced and balanced prediction across categories.
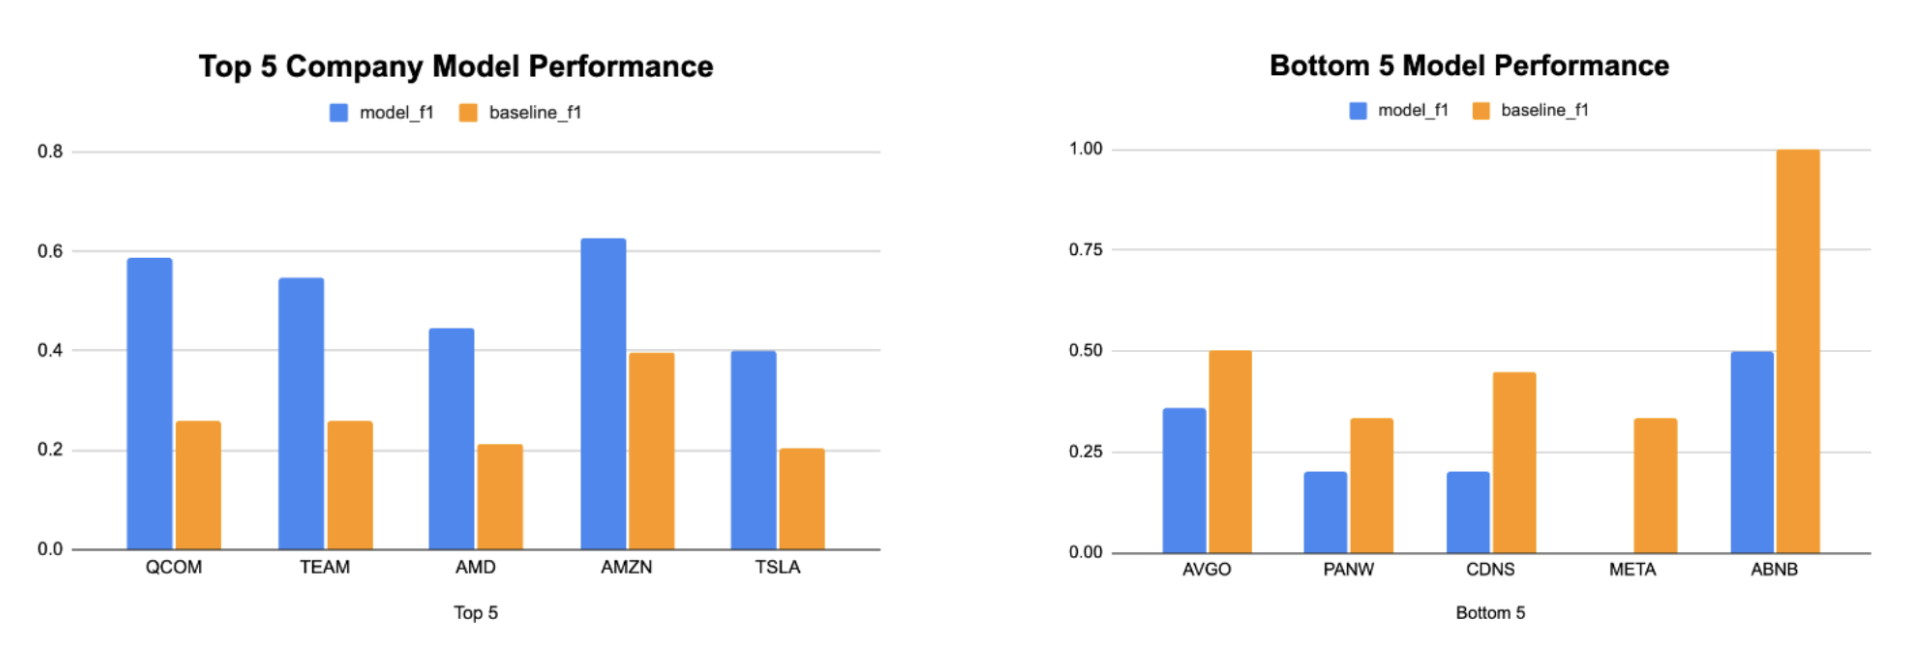
The Longformer model’s performance exhibits variability when predicting stock movement post-earnings calls across different companies (Figure 14).
Figure 14: Company-Specific F1 Score
The model demonstrates better predictive performance for certain companies, as indicated by a higher F1 score relative to the baseline for firms such as Qualcomm (QCOM) and Amazon (AMZN). Conversely, the model's predictive capability appears weaker for other companies, notably Meta (META) and Airbnb (ABNB), where the baseline's F1 score surpasses that of the model.
Several factors could account for the variability in model performance across different companies:
- Sector-Specific Language: Different industries may use unique phrases and financial terminology. The model may be better at interpreting the language of certain sectors, like technology or consumer goods, leading to better predictions for companies like QCOM and AMZN.
- Disclosure Styles: Companies have differing approaches to disclosing information during earnings calls. Some may provide more quantitative data and forward-looking statements, while others may use more qualitative and general language. The model might be better at interpreting the former, leading to differences in performance.
- Earnings Call Complexity: The complexity of the earnings call narrative can vary significantly among companies. Complex calls with deep financial details might be more challenging for the model to interpret accurately.
- Market Dynamics: The stock movement of some companies may be more influenced by market sentiment or external factors not captured in the earnings call, leading to lower model accuracy for these firms.
- Data Availability and Quality: The quantity and quality of training data available for each company may influence the model's learning. Companies with more consistent and comprehensive earnings call records could provide the model with better training content.
- Inherent Volatility: Some companies may experience stock price volatility, which could make it more difficult for any model to predict post-earnings call stock movements with high accuracy.
5.2 Attention Analysis
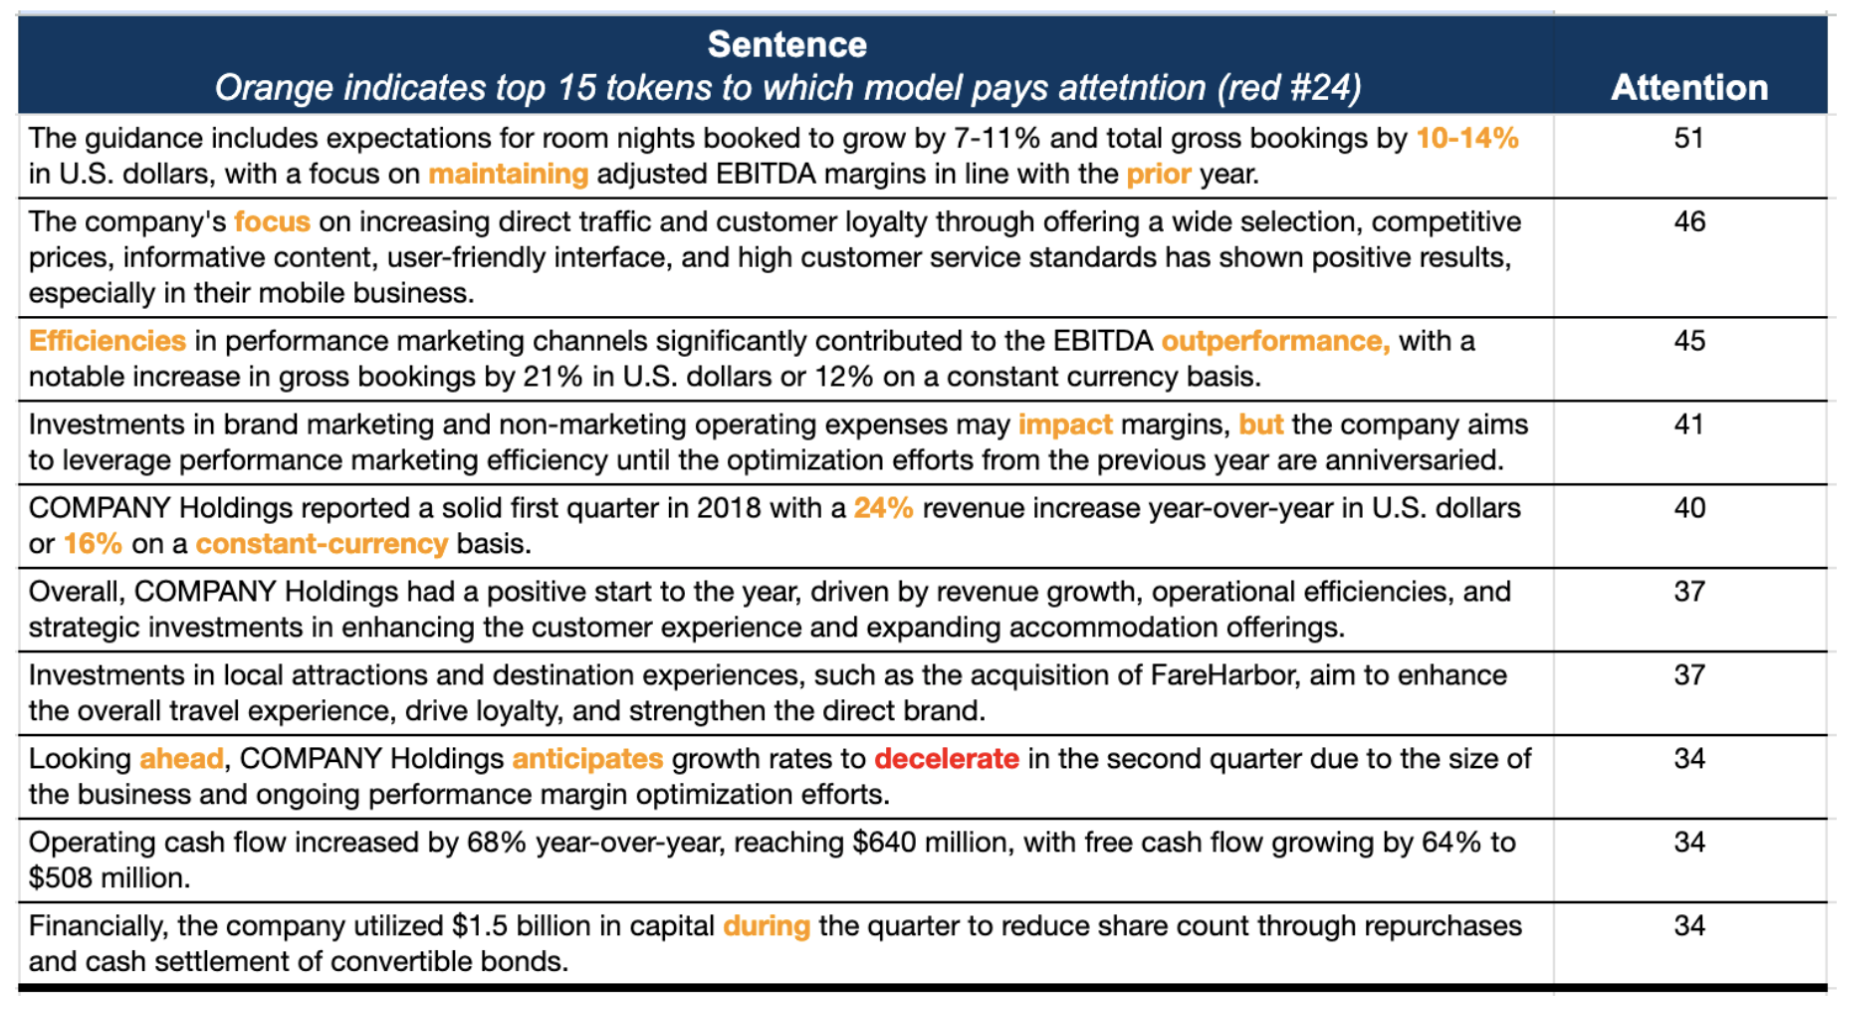
We leverage the most confident prediction of the model that is wroing to illustrate the parts of the earnings call on which the model is placing attention and to understand the Longformer model’s focus and potential biases. The attention mechanism in transformer models like Longformer is a window into the model's "thought process", showing us which words or phrases are most when making a prediction. We averaged the attention across all layers and heads because the collective pattern across the model provides a holistic view of the prediction-making process. (Figure 15)
In this illustrative case, the model predicted a 'Neutral' outcome with 99.92% probability, while the true label was 'Bearish' and the stock experienced a 5.6% drop. . Our attention analysis revealed that certain phrases like "room nights booked to grow by 7-11%" and "total gross bookings by 10-14%" received high attention scores. This suggests that the model may have placed undue emphasis on these forward-looking statements, interpreting them as indicators of stability or growth, leading to a 'Neutral' prediction.
Figure 15: Top Sentence and Word Attentions
This discrepancy could be due to a few reasons:
- Optimistic Language: Management often strikes an optimistic tone, which can mislead the model, especially when actual financial metrics do not support such optimism.
- Complex Financial Language: The language used in earnings calls can be nuanced and area-specific and thus interpreted differently in different contexts, making it challenging for the model to accurately gauge the sentiment.
- Contextual Overlap: Phrases such as "anticipates growth rates to decelerate" and "ongoing performance margin optimization efforts" may not have been weighed adequately against more positive phrases, leading to a neutral prediction despite bearish indicators.
- Quantitative Overemphasis: The model may overemphasize quantitative forecasts (like specific growth percentages) without fully integrating them within the broader qualitative context.
The attention insights suggest that the model's high confidence in the 'Neutral' prediction is likely driven by a combination of positive financial expectations and strategic initiatives emphasized in the top sentences. However, the reality of stock performance also depends on external factors and investor perceptions that may not be fully captured in the semantic content of earnings calls.
6. Conclusion and Future Work
Our study’s goal was to assess the predictive power of semantic analysis on earnings call transcripts relative to next-day stock price movements. We leveraged advanced Large Language Models (LLMs) such as BERT and Longformer and a ~1900 processed sample of earnings call transcripts to assess if we could identify patterns that could serve as reliable indicators for financial analysts and investors.
Key findings reveal that while LLMs hold potential in financial predictions, their performance varies across different companies and sectors. The Longformer model, which processes extended text sequences, showed the best results with a balance between accuracy and weighted F1 score, outperforming traditional quantitative models, which demonstrated the significance of semantic content in earnings calls.
For investors and financial analysts, these findings suggest that incorporating semantic analysis into their evaluation process could improvements to their standard process. The nuanced understanding provided by semantic analysis could complement existing quantitative approaches, potentially leading to more informed investment decisions.
However, this study has limitations. We leveraged the Longformer Base model with 180 million parameters, which is much less powerful than most complect models, which offer over 1 trillion parameters and more nuanced semantic capabilities. Computing power in our study was a constraint, limiting the use of those more powerful models. Future research could explore the use of more complex models such as LLAMA 2 70B, GPT 3.5, or even larger iterations like GPT-4, which may capture more nuances and improve performance. Additionally, while Longformer's capacity to process up to 4096 tokens minimizes the loss of context compared to BERT, its sparse attention mechanism may not capture the full range of semantic content present in earnings calls.
For future research, we recommend exploring more granular and sector-specific models that can navigate the financial language and reflect the diverse disclosure styles of companies. Enhancing the dataset with more data beyond the top 50 NASDAQ companies' calls could also provide a more grounded training corpus for the models. The integration of additional quantitative and qualitative data sources, coupled with a more refined approach to feature engineering, could generate further insights and strengthen the predictive framework.7
7. Limitations
The current study's scope encounters several limitations that provide opportunities for future work:
- Model Complexity: Using Longformer Base with 180M parameters is a step forward, but more complex models like GPT-3.5 or GPT-4 could offer deeper semantic comprehension and predictive accuracy.
- Computing Power: The limitation in computational resources restricted the ability to employ larger, more sophisticated models that require significant processing capabilities.
- Token Limitation: Longformer's 4096 token limit, although larger than BERT’s 512, still imposes a limitation that could reduce some earnings call transcripts, leading to the potential loss of valuable information.
- Sparse Attention Mechanism: The inherent design of Longformer emphasizes certain parts of the text over others, which could lead to overlooking subtle but critical nuances within the transcripts.
- Training Data: The dataset, while robust, may not fully capture the market's dynamic reactions to earnings calls, which are influenced by a multitude of factors beyond the transcripts.
- Sector-Specific Idiosyncrasies: The study did not account for the sector-specific language and sentiment that can significantly influence the model's ability to generalize across different industries.
- Sentiment Analysis: The challenge of accurately interpreting sentiment and tone from text, particularly with financial jargon and complex narrative structures, remains a challenge.
References
1. Schumaker, R. P., & Chen, H. (2009). Textual analysis of stock market prediction using breaking financial news: The AZFin text system.
2. Medya, S, Rasoolinejadm Ms et al (2022). An Exploratory Study of Stock Price Movements from Earnings Calls.
3. Shafiq K. Ebrahim (2019). Analyzing Sentiment in Earnings Conference Calls Using LSTM.
4. Ma, Z., Bang, G. et al (2020), "Towards Earnings Call and Stock Price Movement"
5. Hutto, C. J., & Gilbert, E. (2014). VADER: A parsimonious rule-based model for sentiment analysis of social media text.
6. Engelberg, J. E., Reed, A. V., & Ringgenberg, M. C. (2012). How are shorts informed? Short sellers, news, and information processing.
7. Kraus, M., & Feuerriegel, S. (2017). Decision support from financial disclosures with deep neural networks and transfer learning.


