Drought Prediction in California
Problem and Motivation
While cycles of drought are normal for California’s climate, droughts are growing in intensity and length due to climate change. Drought is an extremely costly natural disaster with massive impact on agriculture and water management, not to mention human and other animal life. The impact of the drought in 2022 alone cost an estimated $1.2 billion in crop revenue loss, while the estimated total economic effect of the severe drought in 2015 was $2.7 billion.
While drought cannot necessarily be prevented, its effects can be mitigated through proactive planning and preparation. For government agencies to do so, they need accurate and timely drought predictions. Machine learning approaches can provide such predictions.
Data Source & Data Science Approach
We trained multiple machine learning models using previous U.S. Drought Monitor drought classifications and local weather data originally obtained from the NASA Langley Research Center (LaRC) Power Project. Weather variables included temperature, humidity, windspeed, precipitation, and pressure by U.S. FIPS code at the daily level and corresponding weekly USDM drought score between 2000-2020.
The machine model approaches we used were models that showed promising results in previous literature with time series data, specifically a convolutional neural network (CNN), long short-term memory (LSTM) recurrent neural network, random forest, and extreme gradient boosting (XGBoost).
Evaluation
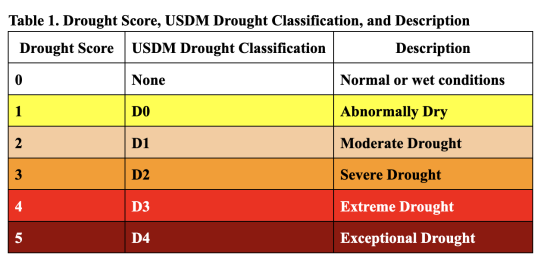
The main evaluation metric for this task was macro F1 score based on a binary classification of the model’s ability to predict “severe” drought, or USDM drought classification of D2 (score of 2.5) or higher. Other evaluation metrics used were mean absolute error (MAE) and mean squared error (MSE), which demonstrated deviation from predicted and actual drought score, which was on a scale of 0-5.
Key Findings and Impact
The best-performing model, LSTM, was able to achieve a macro F1 score of 0.90 and weighted F1 of 0.96 in predicting severe drought, with a MSE of 0.32 and MAE of 0.33, for a forecasted window of 1-12 weeks using only 30 weeks of past data.
The LSTM and second best-performing model, XGBoost, were able to achieve reasonable F1 scores for up to 16 weeks forecast horizon, with best macro F1 scores for 4 weeks forecast horizon (LSTM: 0.96, XGBoost: 0.95) and worst at 16 weeks (LSTM: 0.87, XGBoost: 0.85) forecast horizon. Our findings suggested that using at least 24 weeks of data was sufficient to achieve optimal results, with minimal difference in performance for increasing the weeks of past data for training.
Results also suggested that when models erred, they mostly underpredicted scores as opposed to overpredicting, likely due to the inherent imbalance in the data. Severe drought scores made up roughly 10% of the dataset.
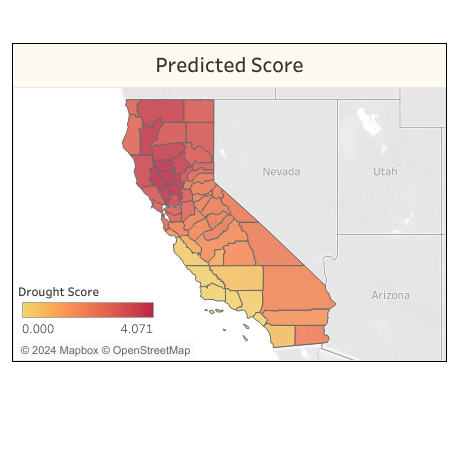
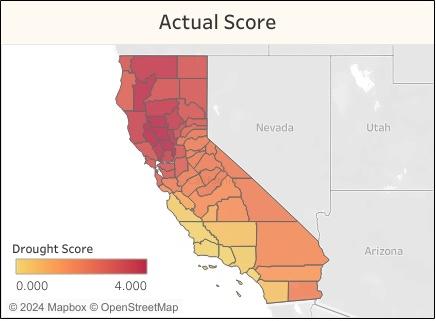
When evaluating performance at the county-level, the LSTM model was able to perform well on over half of CA counties, with F1 scores of 0.86 or higher. However, model performance did vary, with the poorest F1 performance in counties that had severe drought ratio, defined as the number of severe drought cases out of all test scores for that county, of less than 0.7%. In terms of MSE and MAE, the model performed well, or had lower errors, in the central region of the state.
Acknowledgements
We thank our capstone instructors, Dr. Fred Nugen and Dr. Korin Reid, for their feedback and guidance throughout the process, as well as our 271 instructor, Vinod Bakthavachalam, for his help with our time series questions.
We also want to thank and acknowledge Professor Laurel Larsen, Associate Professor in the Department of Geography at UC Berkeley, and Dr. Chris Funk, Director of the Climate Hazards Center at UC Santa Barbara, for their time and support in getting feedback and insight into the drought prediction task.


