GASP: Gauging Air Status With Photography
Problem & Motivation
Air pollution is modern day fact of life. It is everywhere from the urban landscapes of Los Angeles to the remote villages of India. It is a ubiquitous challenge with tremendous health impacts. This is particularly true for the 500 million people around the world that suffer from chronic respiratory disease, the third leading cause of death globally. For people struggling with this deadly ailment, air pollution is the second leading risk factor.
Unfortunately, many people living in developing nations or other remote, sparsely populated areas don’t have good access to reliable information about the air that they breathe. GASP seeks to solve this problem by utilizing a resource that many already do have—their smartphone. By using ML image processing techniques GASP provides users with a quick, inexpensive app to determine the current air quality classification. GASP also allows users to determine which groups should be concerned about the current air quality and what actions should be taken to protect their health.
Data Source
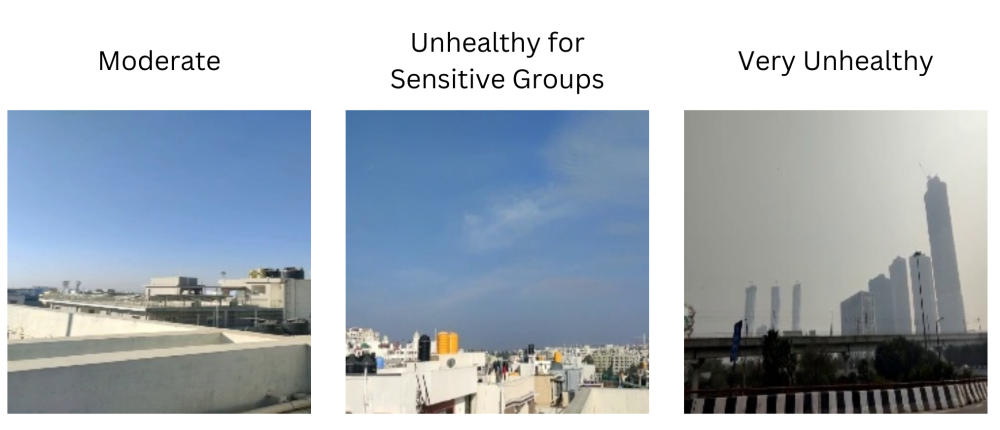
We have utilized three existing datasets comprising over 14,000 images taken across India, Nepal, and Bangladesh. Each image is paired with one of seven different air quality labels ranging from “Good” to “Severe”, indicating the air quality represented by each image.
A common limitation of previous research is that many photos were taken at the same location and at the same time with only a slight change in angle. These duplicated photos may cause data leakage problems during model training and evaluation. Our solution is to combine the three data sources from previous research, fully deduplicate the images, and ensure their AQI scales are comparable. We summarize our data source below.
Dataset | Location | Number of photos | Number of distinct photos | AQI Scale |
1. (Link) | India, Nepal | 12,240 | 125 | China Ministry of Environment |
2. (Link) | Bangladesh | 1,818 | 396 | US EPA |
3. (Link) | Unknown | 465 | 465 | US EPA |
Total | 14,523 | 986 |
Data Science Approach
Data Preprocessing
We have taken four primary preprocessing steps:
(1) Resizing: adjusted to a standard size (224, 224, 3)
(2) Deduplication: eliminating some images that were taken at the same place and time
(3) Balancing: oversampling the categories with fewer than average samples.
(4) Normalization: adjusting the range of pixel intensity values in an image to a standardized scale to enhance contrast and ensure consistency.
Models
Transfer learning is very helpful in increasing the model performance, since we have limited data. Inspired by previous research, we explored two primary families of models:
(1) Pretrained CNN models including VGG16 and Efficient Net
(2) Pretrained Vision Transformer models including ViT by Google
We keep the pretrained weights for the fundamental layers while fine-tuning the last several layers.
Evaluation
The ordinal nature of AQI Category enables us to use both classification and regression metrics for the evaluation. We use MSE as the loss function for model training but evaluate the performance with a wide range of metrics: accuracy, MAE, Spearman Correlation Coefficient, and confusion matrix.
The result below shows that our best model, the ViT model, doubles the accuracy and reduces the MSE and MAE to 29%~54% of the baseline CNN model. Although the predictions may not be as accurate as a home AQI monitor, they can still be very useful references, especially considering the availability and convenience of our solution.
Accuracy | MSE | MAE | S-Cor | |
baseline_cnn | 0.23 | 2.19 | 1.18 | 0.32 |
vgg16 | 0.46 | 0.98 | 0.75 | 0.67 |
efficient_net | 0.51 | 0.88 | 0.72 | 0.71 |
ViT | 0.46 | 0.64 | 0.64 | 0.82 |
Key Learnings & Impact
Traditional air quality monitoring requires costly equipment that measures a number of different pollutants including: particulate matter, ozone, nitrogen dioxide, carbon monoxide, and sulfur dioxide. Given that a number of these pollutants are invisible, attempting to accurately classify air quality with photography equipment alone is a challenging task. As such, our accuracy is below what we would ideally like to be able to provide. We do believe however, that we have successfully demonstrated the potential of such an application. With a larger dataset taken from a wider variety of geographic locations, we believe significantly higher accuracy is achievable.
Acknowledgements
We would like to thank our Capstone instructors, Zona Kostic and Todd Holloway for their guidance and technical recommendations throughout the semester.


