Litter Log
Problem & Motivation: Pollution from single-use consumer packaging is ubiquitous, and the adverse effects of this pollution are both extensively researched and evident. The prevalent narrative suggests that end-users should be responsible for recycling, but placing this responsibility solely on consumers isn’t enough. Companies package products in glass or plastic that theoretically could be recycled but often aren't, as evidenced by the littered streets and waters in our communities. Furthermore, large corporations lack the incentive to address this issue, and there is currently no accountability or identification for the brands' contributions to this problem. Litter Log aims to influence users’ purchasing decisions, encouraging them to shift their buying habits toward brands that have reduced their environmental pollution impact. Additionally, Litter Log seeks to provide insights to companies, incentivizing them to take action to minimize their packaging pollution impact.
Data Source & Data Science Approach: Our approach is to provide users insightful data at the most opportune moment: time of purchase, when it has the greatest potential to influence decisions. A browser extension serves as a vehicle to convey the data to the users during their online shopping activities. The data that we show gives the user the level of pollution from the brand they consider purchasing from. This data comes from analysis and classification outputs from images of street litter captured by the users of Open Litter Map, an app where users upload photographic instances of litter in their communities. We investigated a collection of computer vision models to extract pollution statistics from these images.
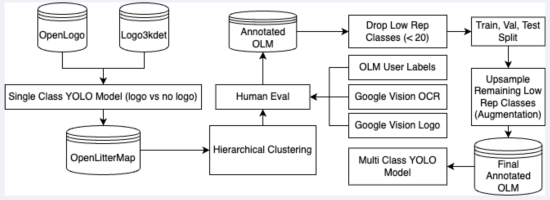
Among our biggest challenges was creating labels for our data as OpenLitterMap does not provide useful annotations. Rather than hand labeling 27K images, we combined efforts including object detection, clustering, pre-trained models, and human evaluation to generate labels. We started with OpenLogo and Logo3kdet, pre-labeled datasets of images of brand logos that were taken mostly for marketing purposes and thus were of much higher quality than the images of litter. These were used to train a single-class YOLO model that can detect a logo in the image. We applied this model to the OpenLitterMap dataset, generating bounding boxes for potential logos.
Next, we performed hierarchical clustering on the results to group similar images to identify potential classes. After clustering, we assigned names to the clusters, manually corrected mistakes and added missing annotations. While the dataset was now labeled, it suffered from class imbalance, where we then sought out additional class examples from OLM as well as used Google Vision’s logo and optical character recognition models to add more examples. We did not consider classes with less than 20 example images. We then split the dataset into training, validation, and test sets and upsampled the remaining low-representation classes in the training set using augmentation techniques. This final dataset was used to train a multi-class YOLOv8 model that can identify specific brand logos. We then pushed the entire OLM dataset through this model and used the brand frequency to derive the brand ranking shown to the end user.
In the process of investigating for alternative approaches such as using EffNet image classifier on the bounding boxes produced by the first YOLO model, or relying on cosine similarity between image embedding to group brand images together, but the results of these approaches were clearly inferior to the YOLOv8 model mentioned above.
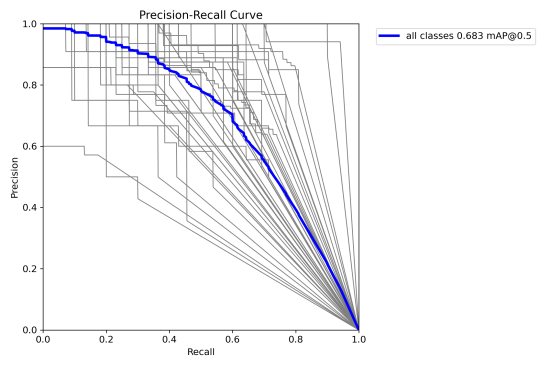
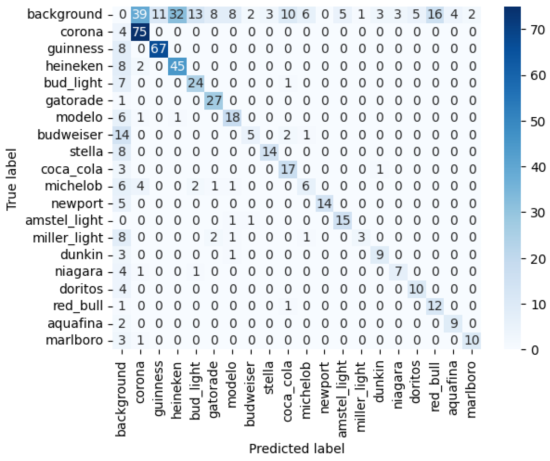
Evaluation: YOLOv8 model trained on the data set described above outputted a median Average Precision (mAP) 68% in some tests. The confusion matrix shows that performance remains relatively uniform for all brands. Amstel and Budweiser are two exceptions where the model misses more than 50% of all instances. We believe that this is an acceptable performance, despite moderate overall mAP. The key problem that we avoid is brand confusion: the model rarely confuses one brand for another. There might be instances that are missed, but if the model says it is “Amstel Light”, it is never “Corona”, despite Corona being approximately 5 times more frequent in the dataset. While this is problematic, it has little effect on user’s perception of the brands. When the model flags Corona and Heineken as the worst polluters, we are certain it is not “Miller” or “Amstel”.
Key Learnings & Impact: We believe our solution is positioned to deliver a significant impact by providing visual information at the critical moment of purchasing. The browser extension integrates LitterLog insights directly into the shopping experience, displaying a brand’s litter score to the user at the time of purchase, when the likelihood of influencing a decision towards an environmentally friendly brand is highest. Additionally, the low cross-brand confusion offers brands assurance that they are not held accountable for the deficiencies of others.
To deliver this impact we had to overcome a few hurdles. Mainly, our attempts at automated data labeling demonstrated the sensitivity of object detection models to the context of the image that might not even register in the mind of a human. Fundamentally, the models find image areas that are similar to the training examples, irrespective of what confers this similarity. Thus, bottle caps were clustered together no matter what brands they had and a round Starbucks logo was often confused with a round cup lid. We alleviated this issue by judicial augmentation of the training dataset, but a lot more relevant data would be needed to resolve this issue.
Acknowledgements: We are grateful to Open Litter Map for sharing the data and valuable insight.


