PriceProphet
Problem & Motivation
E-commerce marketplaces can be daunting places to navigate for even the most experienced buyers and sellers. An overwhelming variety of products, in a range of conditions, subject to different shipping terms: all these factors can obscure the fair value of any given product. This complexity is evident even in a smaller sub-segment of online shopping, such as the market for used and vintage clothing – a popular and growing area for e-commerce. Existing pricing tools in e-commerce marketplaces often price lower than expected for their own financial benefit.
PriceProphet is a price suggestion tool for both buyers and sellers to help make shopping for clothing items more efficient. This tool will help users determine the fair market price for items up for sale in order to minimize wasted time and uncertainty for buyers and sellers alike. Our mission is to optimize e-commerce efficiency and promote price transparency for all.
Data Source & Data Science Approach
There are three primary data sources utilized to create our pricing tool:
- Mercari Price Prediction dataset (Primary)
- Over 700,000 observations of product listings pulled from the Mercari e-commerce platform between 2018-2019.
- Contain listing characteristics such as item title, category, brand, description, as well as ultimate sales price.
- Originally sourced from Kaggle.
- Amazon review data (Supplementary)
- Dataset of Amazon product listings and reviews, containing similar fields to the primary Mercari dataset.
- Most recent listings are used to supplement original Mercari data and vary available training data from a different e-commerce platform.
- Originally collected by UCSD, complete dataset contains over 230 million product listings from 1996-2018 (filtered to about 100,000 listings to supplement our dataset).
- eBay Finding API (Secondary / Tuning)
- The eBay API was utilized to collect information on current product listings in order to understand changes in the market environment since primary data was collected in 2018-2019.
- Over 120,000 observations were collected, based on cluster criteria (discussed below) of the primary training data.
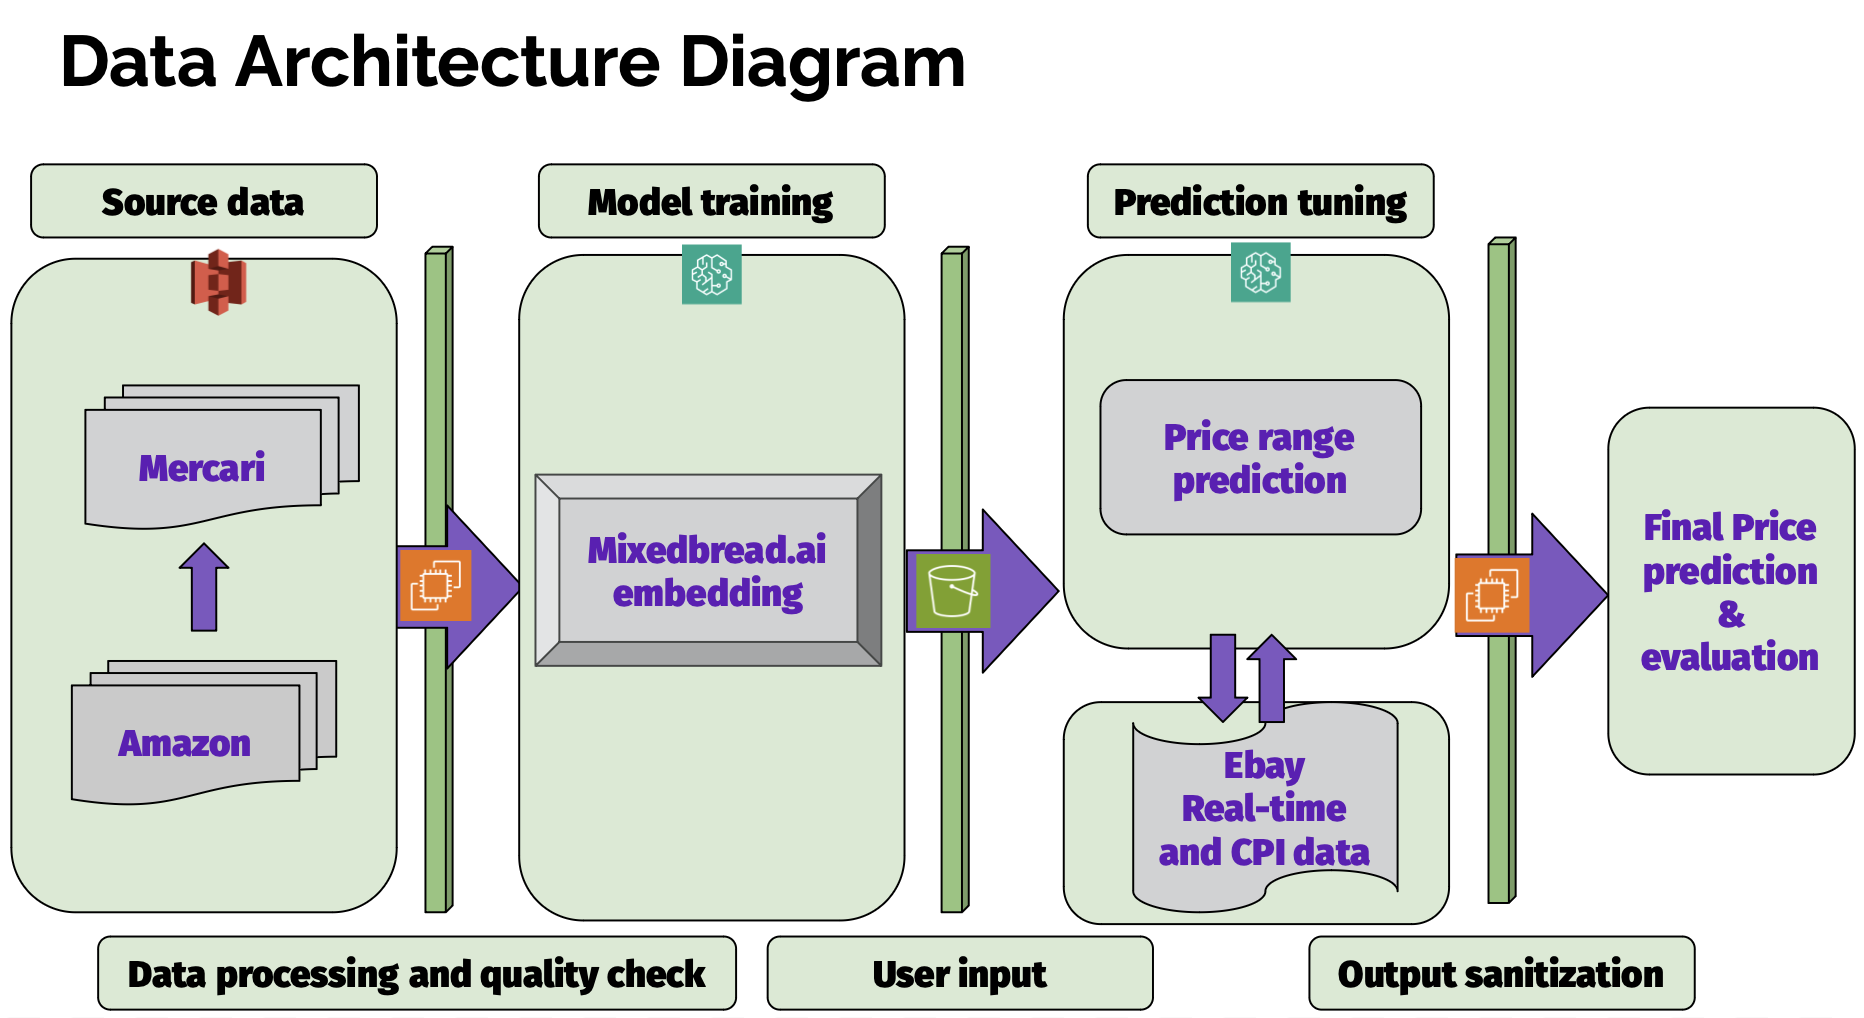
After initial EDA, we narrowed our use case to create a pricing tool specific to clothing and accessory items, leaving about 800,000 observations for model training. Our approach involved passing training data into MixedBread.ai, an embedding model using TFIDF vectorization, which utilized mini-batch K-means clustering on relevant text from product titles, categories, brand, and description. The price range prediction output by these clusters was then “tuned” using current eBay listings and Consumer Price Index (CPI) inflation data to represent current market conditions. Individual prices are then predicted within each cluster by a regression analysis on relevant characteristics such as item condition and shipping types. Our data flow is described in the diagram below:
Evaluation
We utilized a Root Mean Square Logarithmic Error (RMSLE) metric to measure our model performance against similarly constructed pricing tools. In addition, we compared our model predictions to those of existing pricing tools on the Mercari platform to understand how it would perform in a real world context.
RMSLE is an error metric that proportionally penalizes mis-predictions at the lower and higher ranges of the output scale. This is particularly useful when determining the accuracy of price prediction because we’d want our model to be effective both in predicting cheap products and expensive products. Our measured error of .42 can be approximately understood as an average deviation of 42% from the predicted value to true value. So if the model predicts $100 as the sale price, this 42% deviation could lead to a true price as high as $142 or as low as $58.
In addition to RMSLE, we evaluated our model by comparing predicted price ranges to those outputted by the in-built tool on Mercari. This comparison suggested that Mercari's tool systematically underestimated product prices, while our model yielded relatively higher, and more realistic predictions, while outputting a narrower price range of possible prices.
Key Learnings & Impact
Navigating Data Collection Challenges
-
Diverse Data Acquisition: Collecting varied data sources taught us the complexity of sourcing information from diverse platforms.
-
Integration Hurdles: Overcoming challenges in merging datasets underscored the importance of seamless data integration for actionable insights.
Prioritizing Real-Time Updates
-
Timely Information Importance: Recognizing the value of fresh data, we understood the necessity of real-time updates for relevant insights.
-
Future Focus: Moving forward, we prioritize maintaining data freshness, ensuring our product remains relevant and insightful for users.
Putting Users First in Design
-
Feedback-Driven Design: Iterating based on user feedback underscored the significance of user-centric decisions.
-
Experience Enhancement: Creating an intuitive dashboard highlighted the importance of accessibility and usability.
Reflecting on Our Journey
Our journey taught us key lessons in data collection, scalability, and user-centric design. By embracing these principles, we've developed a tool that not only tackles data challenges but also prioritizes user needs. As we evolve, our commitment to delivering relevant, timely insights remains steadfast, guiding us towards impactful solutions in the dynamic e-commerce landscape.
Acknowledgements
We’d like to thank our section instructors Joyce Shen and Kevin Hartman for their guidance as our project took shape. We’d also like to thank Spring 2023 Capstone team secondhand.ai for being willing to discuss the data collection strategies they used to approach a similar problem.


