QuickBite: Transforming Every Bite into Insight
Problem & Motivation
Regularly measuring calorie intake presents significant challenges for the average consumer due to several factors. Accurately assessing portion sizes, interpreting nutritional labels, and accounting for the composition of meals, particularly in restaurant settings or with homemade recipes, can be complex and prone to error. Many food items lack readily accessible or clear calorie information, making estimation difficult and often leading to inaccuracies. Furthermore, the process of consistently monitoring and recording food consumption requires substantial effort and attention, which can become mentally taxing and time-intensive. While digital tools and applications may assist with tracking, they still demand active user input and adherence, contributing to the perceived burden of routine calorie monitoring.
The failure to accurately identify food contents can have significant and far-reaching consequences, particularly for individuals with specific dietary needs, allergies, or health-related restrictions. For those with food allergies, a lack of ingredient transparency can result in severe and potentially life-threatening reactions, such as anaphylaxis, when allergens like nuts, shellfish, or gluten are unknowingly consumed.
Individuals managing health conditions, such as diabetes or hypertension, may inadvertently consume harmful quantities of sugar, sodium, or fats, thereby worsening their health outcomes. Moreover, individuals adhering to dietary restrictions for religious reasons (e.g., halal or kosher) or ethical choices (e.g., veganism or vegetarianism) may unknowingly violate their dietary principles due to hidden or unclear ingredients, leading to personal, ethical, or religious distress.
The absence of clear labeling or accurate ingredient information can further result in negative long-term health effects, such as poor nutrition or the development of chronic conditions, as consumers are unable to make informed choices about the nutritional quality of their food. Thus, transparency in food labeling is essential for ensuring public safety, respecting dietary preferences, and promoting overall health.
Our Solution
Tedious food logging will be a thing of the past, simply snap a picture of your dish, and let QuickBite do the rest!
QuickBite will analyze your meal, providing detailed nutritional information, including calories, macro, and even micronutrients.
From a survey done in 2021 (Vasiloglou et al., 2021) with 2.4 thousand participants with a median age of 27, about 60% are self-declared as health conscious, however, only 30% of adults track their diet. To reduce the friction of laboriously hand tracking on paper or typing in details of your meals, QuickBite seeks to eliminate as much manual overhead giving you direct access to insights of your nutritional intake. QuickBite will be able to deconstruct your meal into potential ingredients, its nutritional components, and dietary tags so whether you’re tracking your health goals, managing dietary restrictions, or simply looking to gain insights into your eating habits, empowering users' toward a healthier lifestyle.
Data Source & Data Science Approach
Data Pipeline
Our model pipeline consists of 4 key steps:
- Data Source: Exploring available datasets
- Exploratory Analysis: Reviewing the dataset and performing data cleaning and augmentation steps
- Training: Utilising our data, train models (YOLOv8 & DeiT); Alternatively using off-the-shelf GPT4o involves prompt engineering
- Evaluation: Scoring models' performance and deciding how best to integrate with QuickBite application
Data Source
- 118,475 training images collected from the web
- 11,994 images in the validation set
- 28,377 images in the test set
Exploratory Analysis
Upon reviewing the data, we noticed a significant portion of the data did not correctly label the images for our intended photo-based food requirements due to definitions of the labels being misinterpreted (e.g. "Farfalle" being both the pasta and the word for "butterflies" in Italian included images of both. "Chili" refers to both the dish "Chili con carne" and also the musical band "Red Hot Chili Peppers" ) or the modality (e.g. cartoons, text, diagrams, video game screenshots, and people). Additionally, the fine-grain classes in the dataset have very similar dishes such as 15 different types of cakes, and 10 different types of pastas.
Data Cleaning
- Remove all irrelevant images from the dataset through computer vision techniques (e.g. HAAR Cascade, Optical Character Recognition)
- Reduce the range of classes, which ultimately resulted in our dataset focusing on 25 out of the original 251 classes and 6k images for our training dataset
Data Augmentation
To augment our dataset, we applied brightness, contrast, flip, rotation, blur, shear, drop, and cutout techniques to provide to our models to train on.
Model Exploration
We conducted a panel of models which included:
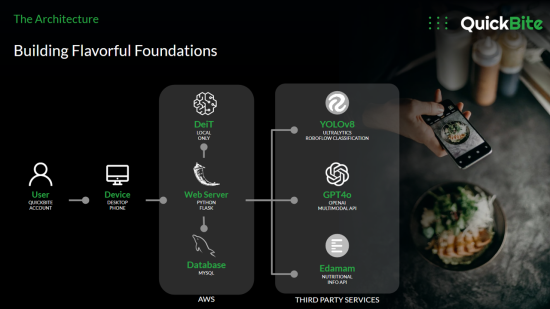
- YOLOv8 | Ultralytics You Only Look Once Classification
- DeiT | Data-Efficient Image Transformers
- GPT4o | Generative Pre-trained Transformer 4
We conducted our own training on YOLOv8 and DeiT while directly submitting images using a tuned classification prompt to GPT4o to then compared our results across all 3 models which we will discuss more in the evaluation section.
Evaluation
Model Selection Evaluation
While accounting for our goal of building an application to serve as a food diary product we worked with UX designers as well as conducted interviews to understand potential users which ultimately led to coming up with a Top N Accuracy being our preferred most focused metric. The concept is based on the user experience in the application where N predictions will be returned to the user to confirm which will be the Top N softmax output from our chosen model.
| Evauluation Metric | YOLOv8 | DeiT Transformer | GPT 4o[1] |
| Accuracy % | 60 | 67 | 96 |
| Precision % | 63 | 70 | 96 |
| F1 Score | 0.60 | 0.67 | 0.96 |
| AUC ROC | 0.5 | 0.5 | 0.98 |
| Top N(3) Accuracy % | 61 | 67 | 96[2] |
[1] Likely to have been exposed to iFood labeled date upon training, hence not be the ideal model for production
[2] Top 1 result instead of 3 for single prediction model
Product Evaluation
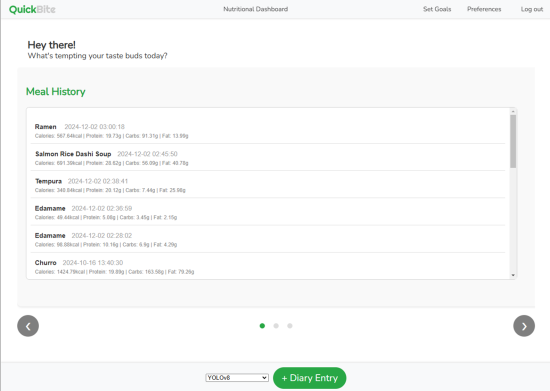
Among user experience and features that QuickBite offers, we can also allow the user to submit a text entry if the softmax does not produce any meaningful predictions. From this, we can use the confirmation of the softmax results against the user text input entries to understand where the model is deficient or if certain food groups should be added to the next iteration of the QuickBiteclassification model.
Key Learnings & Impact
The practical implications of building an application for users is truly understanding what the end users want, this emphasizes the research design process that is perhaps underemphasized compared to the data science techniques themselves. At the end of the day, a service is only valuable if there are end users who will benefit from it, therefore take as much as you can from DATASCI 201.
Data science comes prepackaged with popular metrics, however, given our use case, we realized we can be more flexible with metrics since we anticipate a better user experience when providing multiple results from our softmax output rather than just the top prediction, hence the creation of our Top N Accuracy metric. Evaluation metrics can be justified and synthesized to best suit your use case.
Database infrastructure can grow faster than anticipated. The original scale was a single inference to determine food, however once we expanded to understand users' needs to have stateful requirements in the form of a food diary, we realized that a database was required to store their user details, their meal entries, their goals and their dietary preferences. Plan ahead with what user requirements there are so that the architecture of your database can keep up.
Future Work
From user feedback on our application, the top three additional requirements that have been requested are:
- More Food Classes: Currently with 25 classes, the predictions are fairly limited and often result in the user still having to type in their actual meal's name. We aim to reduce the typing input as part of this application's design
- Estimating Serving Sizes: With all entries currently, the user is still required to submit their serving volume; with homography, it is possible to automatically estimate an approximate size of the serving which will scale the nutritional volumes
- Intake Notifications/Suggestions: Using the historical data of the user, users want QuickBite to suggest to the user what they need to do to achieve their nutritional goals or remind them of certain requirements.
Acknowledgments
Special Thanks
The QuickBite team would like to express gratitude to our section instructors, Fred Nugen and Dan Aranki for the valuable feedback and suggestions that were acknowledged and incorporated into the development of the QuickBite product.
Citations
CDC. (2020, November 9). Products - Data Briefs - Number 389 - November 2020. www.cdc.gov. https://www.cdc.gov/nchs/products/databriefs/db389.htm
Amugongo, L. M., Kriebitz, A., Boch, A., & Lütge, C. (2022). Mobile Computer Vision-Based Applications for Food Recognition and Volume and Calorific Estimation: A Systematic Review. Healthcare, 11(1), 59. https://doi.org/10.3390/healthcare11010059
Devtechnosys. (2021). MyFitnessPal Revenue and Usage Statistics in 2023. Dev Technosys. https://devtechnosys.com/data/myfitnesspal-statistics.php
Fine-Grained Visual Categorization. (2019). iFood - 2019 at FGVC6. @Kaggle. https://www.kaggle.com/c/ifood-2019-fgvc6/overview
Liu, A. (2021, September 27). Classifying Food with Computer Vision. Medium. https://arielycliu.medium.com/classifying-food-with-computer-vision-a47…
Messer, M., McClure, Z., Norton, B., Smart, M., & Linardon, J. (2021). Using an app to count calories: Motives, perceptions, and connections to thinness- and muscularity-oriented disordered eating. Eating Behaviors, 43, 101568. https://doi.org/10.1016/j.eatbeh.2021.101568
Rohan Volety. (2024, March 6). Food Recognition Model with Deep Learning Techniques. Labellerr. https://www.labellerr.com/blog/food-recognition-and-classification-usin…
Vasiloglou, M. F., Christodoulidis, S., Reber, E., Stathopoulou, T., Lu, Y., Stanga, Z., & Mougiakakou, S. (2021). Perspectives and Preferences of Adult Smartphone Users for Nutrition Apps: Web-based Survey (Preprint). JMIR MHealth and UHealth. https://doi.org/10.2196/27885
Writer, C. (2023, December 19). Using Computer Vision to Understand Food and Cuisines. Roboflow Blog. https://blog.roboflow.com/cuisine-classification/


