Sentiment Analysis For Financial Markets
Problem & Motivation
Investors share a universal challenge: the fear of leaving money on the table. Timing the market when buying or selling stocks is notoriously difficult, largely because understanding market sentiment in real time is both complex and resource-intensive. This challenge compels analysts and investors to pour significant time, effort, and money into deciphering the ever-changing opinions and expectations of other market participants.
Despite these efforts, existing platforms like Robinhood, Bloomberg Terminal, and other tools often fall short. They either overwhelm users with excessive information, come with steep costs, or focus on long-term stock movements, which may not align with the needs of short-term decision-makers.
The Solution
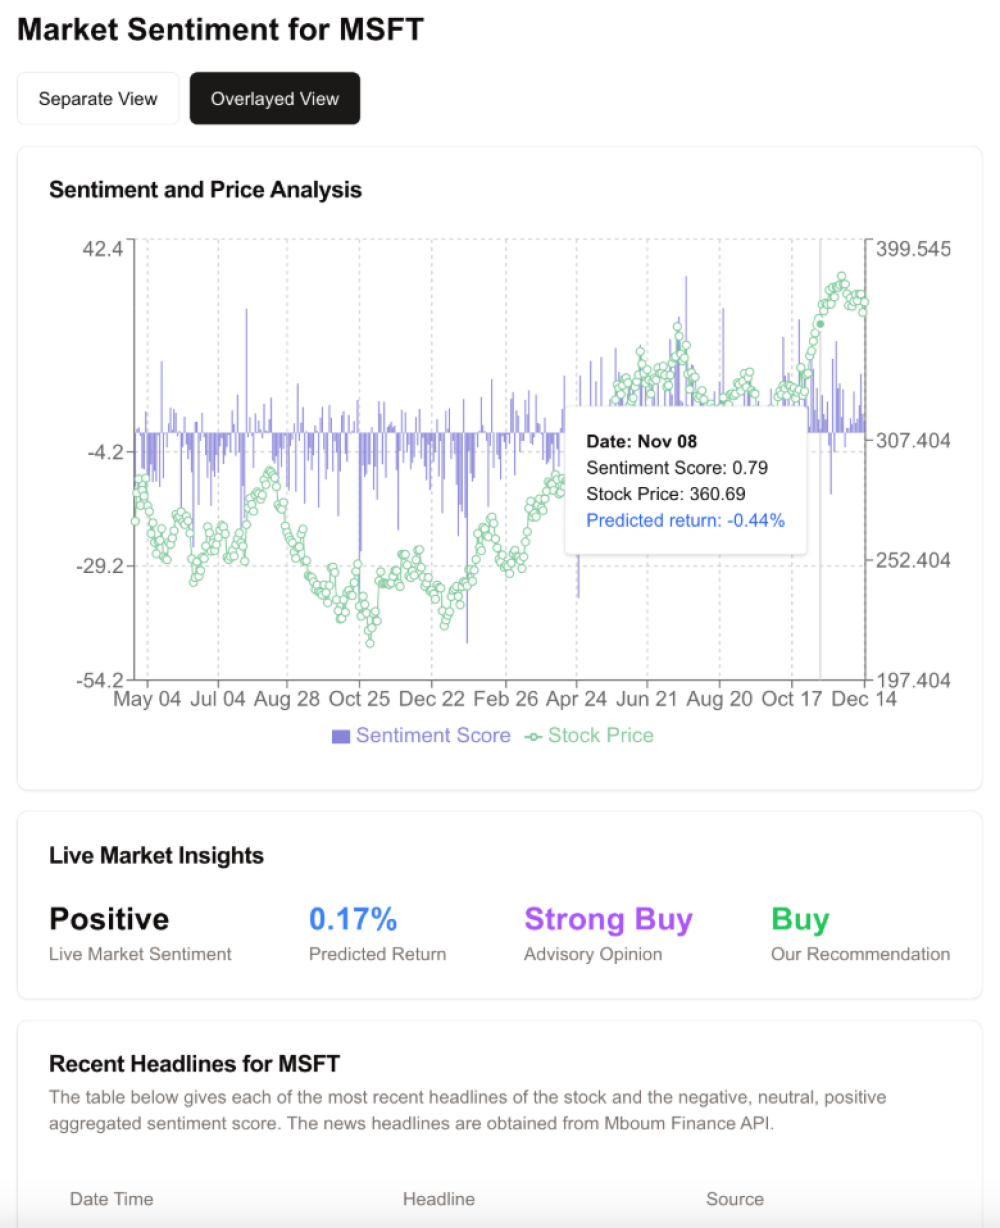
Our website offers a streamlined and highly efficient solution by harnessing the power of deep learning and natural language processing (NLP) techniques to analyze sentiment from real-time financial news, social media platforms, and earnings reports. Unlike conventional tools, it is specifically designed to predict short-term stock movements, providing clear and actionable insights into whether a stock is likely to move up or down in the near term.
Users can easily select their stocks of interest to receive personalized buy or sell recommendations based on the latest sentiment trends. Additionally, they can create and manage a portfolio to monitor multiple stocks worth considering simultaneously. This focused and intuitive approach simplifies the decision-making process, saving time and reducing the mental load for both individual and institutional investors.
What sets our website apart is its cost-effectiveness, user-friendly interface, and dedicated focus on short-term trading. Unlike existing platforms that may overwhelm users with excessive information, incur high subscription costs, or cater primarily to long-term strategies, our website prioritizes simplicity and actionable insights. It bridges the gap between cutting-edge analytics and practical investment needs, empowering users to make confident decisions and stay ahead in an increasingly competitive market.
Data Source
The FNSPID (Financial News and Stock Price Integration Dataset) is a comprehensive financial dataset designed to improve stock market predictions by integrating quantitative stock prices with qualitative insights from financial news. This dataset includes 29.7 million stock price records and 15.7 million financial news articles spanning 4,775 S&P 500 companies from 1999 to 2023, collected from four reputable stock market news websites.
Given the time constraints, we focused on ensuring relevance and accuracy by carefully analyzing the dataset to identify nine companies with a significant volume of financial news coverage and a strong correlation between news events and stock price movements. These selected companies—each with approximately 3,000 associated financial news articles—are Boeing (BA), Merck (MRK), Intel (INTC), Microsoft (MSFT), AMD (AMD), NVIDIA (NVDA), Tesla (TSLA), Alphabet (GOOG), and Apple (AAPL).
Data Science Approach
Dataset Processing
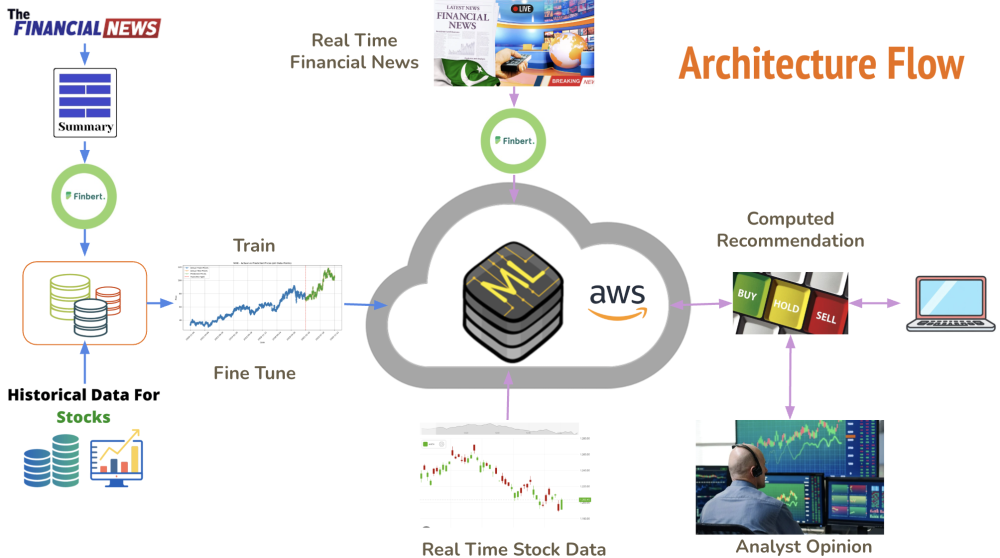
We combined the financial news dataset with the stock prices dataset. Each financial news article was summarized into concise text using Latent Semantic Analysis (LSA), reducing noise while retaining key information. Sentiment analysis was then performed using FinBERT, which generated a sentiment label (positive or negative) along with a confidence score.
Since a single day can have multiple news articles with mixed sentiments, we employed a Weighted Sentiment Score to aggregate them effectively. This score was calculated as:
- Positive sentiment: Add the confidence score.
- Negative sentiment: Subtract the confidence score.
The Weighted Sentiment Score captures the overall sentiment trend for each day and serves as a key feature for stock price prediction.
Model Selection and Training
For modeling, we chose ARIMA (Autoregressive Integrated Moving Average), a widely used time series forecasting method that captures trends, seasonality, and patterns in data. The model was trained to predict stock returns, calculated as (close - open)/open.
Key features included stock-related data, with the Weighted Sentiment Score as the most influential variable. The ARIMA model's performance was fine-tuned by adjusting the following hyperparameters:
- p: Number of past values to use.
- d: Level of differencing to achieve stationarity.
- q: Number of lagged forecast errors included.
Real-Time Processing
When a user selects a stock or refreshes the webpage, the system performs real-time data retrieval and prediction in three main steps:
Data Retrieval and Sentiment Calculation:
- Fetch the latest financial news and stock data for the selected stock with RapidAPI.
- Calculate the Weighted Sentiment Score using FinBERT for the financial news on that day.
Return Prediction:
- Feed the Weighted Sentiment Score and real-time stock data into the pre-trained ARIMA model to predict today's return.
- Compute the remaining predicted return by subtracting today's predicted return from the current return.
- Convert the remaining return into a prediction score based on a predefined threshold.
Recommendation Generation:
- Retrieve real-time buy/sell opinions from reliable professional sources with RapidAPI.
- Combine the prediction score and analyst opinions into a weighted recommendation score.
- Generate and display a buy/sell/hold recommendation to the user.
Scalability
The entire pipeline is automated and deployed on AWS.
Evaluation
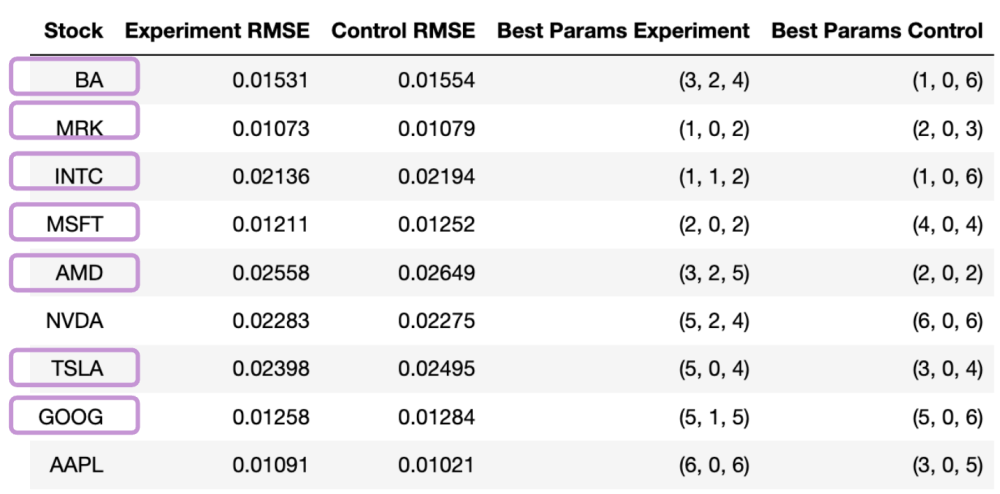
We used Root Mean Square Error (RMSE) as the primary metric to measure the accuracy of our stock return predictions. As a baseline, we excluded the sentiment score feature from the models. Most of our models outperformed this baseline, demonstrating the significant value added by incorporating sentiment analysis. We believe that with cleaner data and better API, even more models would surpass the baseline, further improving performance.
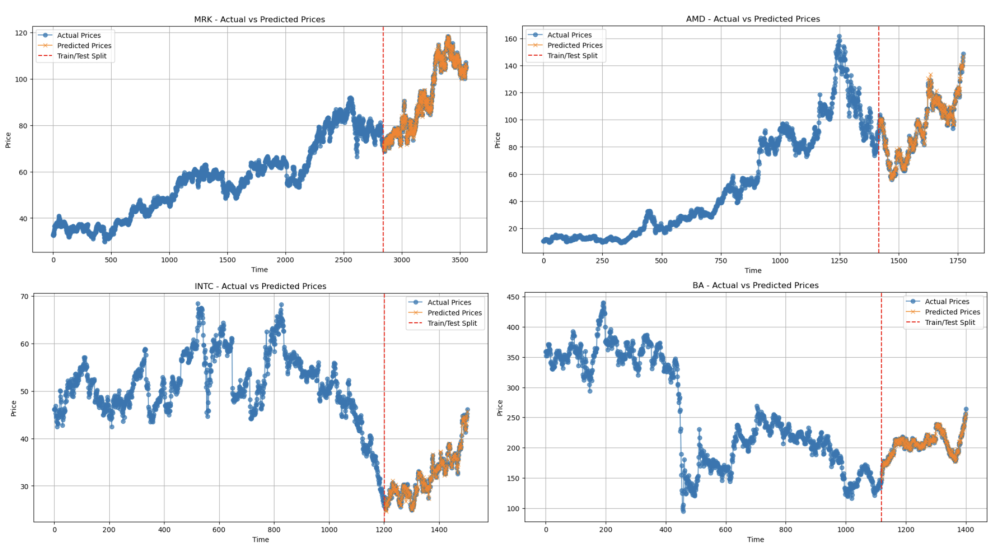
Since stock returns can be challenging to interpret directly, we converted the predicted returns back into stock prices to visualize how closely they align with the actual prices. The predicted stock prices showed a strong overlap with the actual prices, indicating that the model effectively captures price movements.
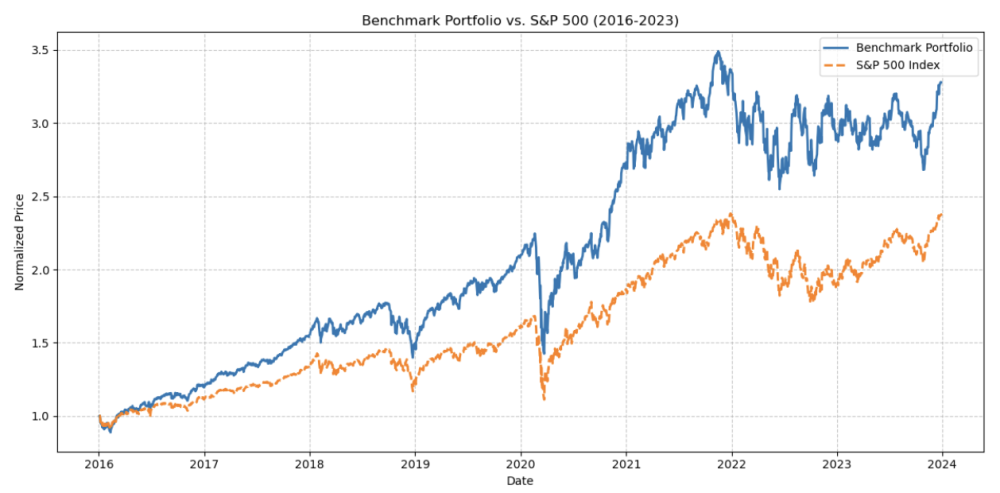
To evaluate the real-world applicability of our approach, we formed a portfolio by selecting stocks with higher sentiment scores. This portfolio yielded a higher return compared to the S&P 500 index, showcasing the practical benefits of incorporating sentiment analysis into stock selection and prediction.
Key Learnings & Impact
In data processing, we learned that what seems logical in theory may not always be practical or effective in application—you truly don't know until you test it. For example, when combining multiple financial news articles into a single sentiment score, we explored several approaches. Initially, we included counts and average confidence scores for all sentiment labels, assuming that more detailed information would improve model performance. However, this approach did not yield better results. We also experimented with incorporating sentiment information from previous days using decayed sentiment scores, expecting it to provide context and enhance predictions. Unfortunately, this method did not improve the model's performance either. These experiences emphasized the importance of rigorous experimentation and validation in finding the most effective solutions.
Real user feedback is invaluable for identifying and addressing issues that may not be apparent during the development phase. Initially, we designed the website to display a detailed "Sentiment Score," believing it would be beneficial and easy for users to understand. However, after asking friends to test the website, we received feedback that the score was confusing and unnecessarily complex. Based on their input, we simplified the design by replacing the sentiment score with straightforward positive, negative, or neutral sentiment labels. This experience highlighted the importance of user-centered design and the need to adapt based on real-world feedback.
This website serves as a valuable tool for making informed buy/sell decisions on individual stocks. Additionally, it allows users to experiment with creating portfolios by selecting stocks with strong sentiment scores, enabling data-driven investment strategies. Once thoroughly tested and validated, the website has the potential to be launched publicly, providing a broader audience with actionable insights and empowering them to make better investment decisions.
Acknowledgements
We sincerely thank our instructors, Dr. Daniel Aranki and Dr. Fred Nugen, for their exceptional guidance and valuable insights, which were pivotal in shaping the direction and success of this project. We are also deeply appreciative of the collaborative spirit and thoughtful input from our peers in Capstone section (009), whose feedback and challenging questions helped refine our ideas throughout this four-month journey.
We extend our heartfelt gratitude to the dataset contributors. Extracting content from websites is an extremely challenging and resource-intensive task, both in terms of technical effort and storage costs. Without their dedication and contributions, this project would not have been possible.
Lastly, we are grateful to the friends and experts who generously shared their expertise and perspectives, broadening our understanding and enriching the overall outcome of this endeavor.


