Smart Solar Sizer
I. Introduction
In 2022, the residential sector consumed more than 1,500 terawatt-hours of electricity in the United States, contributing to ~35% of the country’s total electricity consumption. Rising energy costs and awareness about the impacts of climate change are pushing a number of new and existing homeowners, to install rooftop solar panels, to cut consumption costs, as well as do their part towards a sustainable future. Aspiring homeowners who want to switch to solar energy are faced with an intriguing question: How many solar panels would I need to install to meet my home's electricity needs. This question can be broken down into two parts:
- How much electric energy does my home consume annually?
- What is the total available solar irradiation at my location?
Homeowners are highly motivated about installing rooftop solar until they run into either of the following detractors:
- A sales team at their local vendor/contractor who just want to sell solar equipment, without much consideration of the homeowner's incurred costs and requirements
- An endless web-survey that asks for sensitive information, but fail to produce any usable quote.
- Very complicated solar calculators that often get into too many technical details, or provide estimates only based on solar potential at the homeowners' location, without considering the homeowners energy requirements.
Our product, the Smart Solar Sizer is an innovative ML-backed approach that provides homeowners with a size estimate of the rooftop solar panel installation they would need to meet their annual electric energy requirements. Smart Solar Sizer runs on two machine learning regression models; one for estimating the electric requirements of the customers' home, and another for estimating the total solar energy available for conversion to electricity, at the location of the consumer's home. We package our product in a user-friendly, web-based tool that is easily accessible without the need of credentials. This is made possible, by our privacy-centric web design, of not storing any sensitive information.
II. Market Impact
According to an SEIA (Solar Energy Industries Association) study, the solar industry is the fastest growing renewable energy sector in the USA. In the last decade alone, solar has experienced an average annual growth rate of 22%. Thanks to strong federal policies like the solar Investment Tax Credit, rapidly declining costs, and increasing demand across the private and public sector for clean electricity, there are now more than 179 gigawatts (GW) of solar capacity installed nationwide, enough to power nearly 33 million homes.Predicting energy demand accurately is crucial in optimizing energy management, reducing costs, and enhancing sustainability. Current methods are often generic - relying on historical data and benchmarks, not accounting for facility-specific characteristics and other customizations. It is difficult to provide energy consumption estimates to an individual customer specific to their home. We aim to use existing consumption profiles for residential buildings along with customer inputs to estimate the size of solar PV set-up that they would need to meet their full energy demand.
According to another study published by Grand View Research, the U.S. residential solar PV market size was estimated at USD 7.45 billion in 2023 and is expected to reach USD 7.90 billion in 2024. The residential solar market isWhile California has traditionally dominated the U.S. solar market, other markets are continuing to expand rapidly. States like Texas, Florida, and Ohio all saw major growth in 2023. In addition, now half of U.S. states have installed 1 GW or more of solar, compared to only 3 a decade ago. As demand for solar continues to grow, new state entrants will grab an increasing share of the national market.
We aim to help accelerate the rate of solar adoption through Smart Solar Sizer, which will empower potential solar-adopter homeowners by providing them estimates for the size of the rooftop solar PV system they would need to install, and how it would impact their electric consumption.
III. Product Architecture
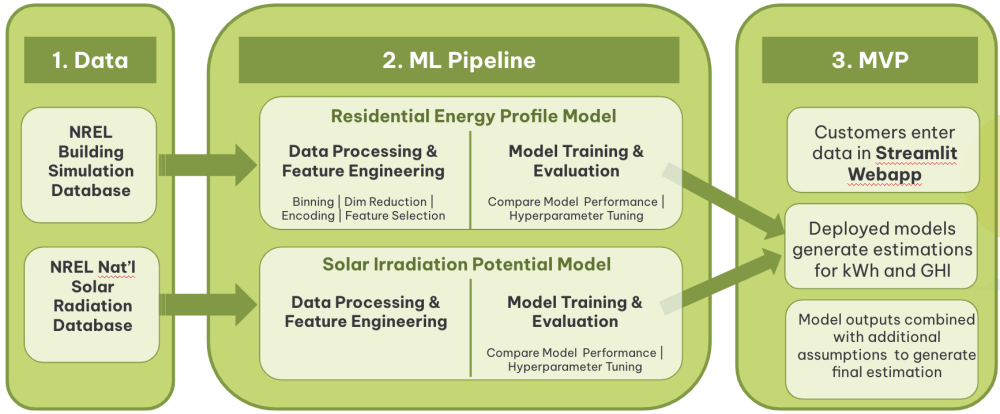
Smart Solar Sizer is an innovative, ML backed user-friendly web tool that provides an estimate of the size of the rooftop solar PV system needed to meet the homeowner's annual electric energy requirements. Under the hood, our product is running 2 ML regression models to estimate the annual electric energy requirement of the homeowner, as well as the solar irradiation potential at their location. Using these parameters, the model calculates the size of the rooftop solar PV system that would be needed to meet the annual annual electric energy requirement of the homeowner. The product architecture is as shown below:
Residential Energy Profile Model
Data Source: Our data comes from the National Renewable Energy Laboratory (NREL) Residential Building Simulation Database and the Solar Radiation Database. NREL is an organization under the U.S Department of Energy and provides comprehensive and authoritative datasets critical for advancing renewable energy technologies and energy efficiency.
The Residential Building Simulation Database offers detailed information on energy use and efficiency in residential buildings, supporting analysis and modeling efforts aimed at improving home energy performance. The database is publicly available and consists building simulation outputs for residential stock of the whole country. The data is based on a decade worth of various national studies conducted by NREL in conjunction with multiple other government agencies.
Pre-processing and EDA: The data pre-processing and feature engineering for the energy consumption model focused on binning and dimensionality reduction to simplify user inputs, despite a slight compromise in accuracy. We filtered the dataset to include only occupied single-family homes, excluding multi-family units, mobile homes, and unoccupied residences and used Principal Component Analysis (PCA) to do an initial feature selection of the most significant variables and remove redundant and highly correlated features.
We tested various binning techniques for numerical features, such as square footage and heating and cooling setpoints, exploring simple (intuitive) bins, quantile bins, and k-means clustering. Categories for heating fuel, cooking range, dryer, and water heater were consolidated by merging all non-electric categories into one, given their similar low electricity usage. For HVAC equipment and efficiency, non-electric categories were combined, keeping heat pumps and electric options separate, and further categorized into low, average, and high efficiency. We also removed any features that the user would likely not be able to answer about their home, such as their infiltration system. Despite the slight loss of information and a minor decrease in model accuracy due to binning and category reduction, these steps were crucial for simplifying user inputs. Finally, all features were mapped to values easily understood by users to facilitate a more intuitive questionnaire experience.
Model Selection: To assess the performance of our residential household annual energy estimation tool, we divided the dataset into training (80%) and testing (20%) sets, ensuring a robust evaluation on unseen data. We tested five machine learning algorithms: linear regression, decision tree, gradient boosting, random forest, and XGBoost. Root Mean Square Error (RMSE) was used as the primary evaluation metric. Our evaluation comprised three distinct experiments:
1. Base Model: This initial phase utilized all 137 available input features without feature engineering, establishing a performance baseline.
2. Non-Correlated Features: Models were trained using only features with a correlation coefficient of less than 0.85 (100 features), aiming to minimize multicollinearity.
3. Important Features: In this experiment, features were engineered (including binning and recategorizing), and redundant features were removed (such as multiple location-type features like longitude, latitude, zip code, state, and city). The features were ranked by importance, and the top 15 were selected based on their relevance and user-friendliness. The final set of features included:
- Presence, type, and fuel of heating system
- Finished floor area
- Latitude and longitude of the location
- Time period of construction
- Number of occupants
- Heating setpoint
- Presence of electric water heater
- Cooling setpoint
- Hot water fixture usage and flow levels
- Lighting type
- Usage of major appliances relative to the national average
- Presence and usage level of washer
- Presence and type of cooling system
Among the evaluated models, XGBoost consistently outperformed others, demonstrating superior accuracy across all experiments. Notably, the removal of highly correlated features resulted in improved model accuracy. However, the final model, which prioritized simplicity and ease of use by reducing the number of features, showed a slight decline in performance. This trade-off was considered acceptable, given the importance of user accessibility.
To optimize the XGBoost model, we conducted a randomized search over a specified range of hyperparameters, employing cross-validation to evaluate each combination. This optimization process led to an RMSE improvement from 3435 to 3338.
Solar Irradiation Potential Model
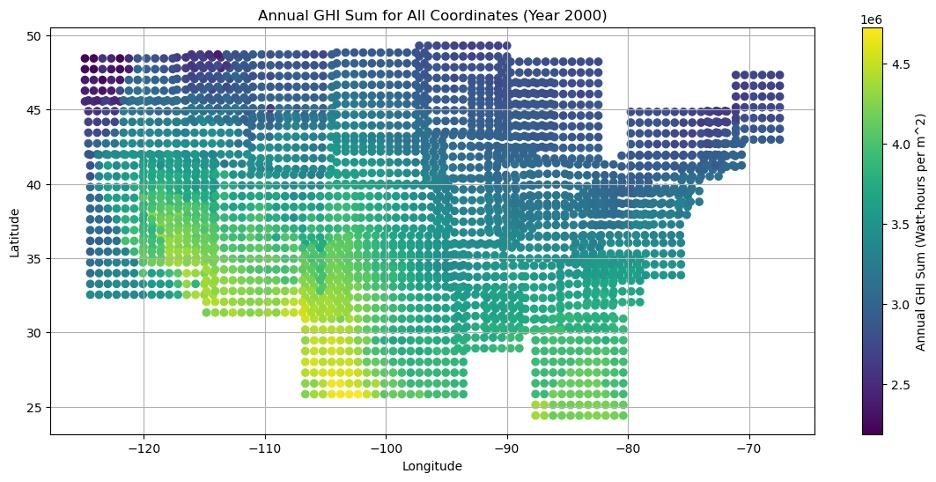
Data Source: The data for the Solar Irradiation Model was sourced from NREL (National Renewable Energy Laboratory)—a federally funded research and development center within the Dept. of Energy. Specifically, NREL’s National Solar Radiation Database was utilized with global horizontal irradiance (GHI) as the chosen metric. GHI is the measure of solar irradiance absorbed by a surface horizontal to the earth and is provided in watts per square meter. The data set was accessible via API and contained solar GHI data for ~600,000 points within the continental US or a spatial resolution of ~4km ( ~2.5 miles). The temporal resolution of the GHI data is 30 minutes and spanned over two decades (1998-2019). For the purposes of the model training, the data was exported at a spatial resolution of ~33 miles within the continental US and the full 30-minute temporal resolution was maintained. This resulted in a dataset which included GHI data for over 2,500 unique latitude/longitude points throughout the continental US, where each location had over 375,000 GHI readings (22-years of 30-minute readings).
Pre-Processing and EDA: The data was accessed with NREL’s API and saved into annual .h5 files state-by-state for ease of API usage. To note, specified borders could only be constrained by four points (max latitude, min latitude, max longitude, min longitude) resulting in specifying states by a rectangle which encapsulated the states full area. The data was initially pre-processed into daily kilowatt-hours per square meter for visualization purposes. This was needed due to the alternating pattern of positive GHI values to zero each day due to nightfall which created unreadable alternating spikes. During EDA, GHI was found to have a high dependence on both time of year and latitude. Southern states received more GHI over the course of an entire year, however in some instances northern states could reach higher daily sums due to the longer daylight hours these areas experience in summer months. Additionally, exploratory work involved comparing annual GHI kWh per square meter across different regions against expected power needs to initially assess the feasibility of required solar panel area to fully meet demand. No missing or anomalous data points were found in the explored NREL GHI data.
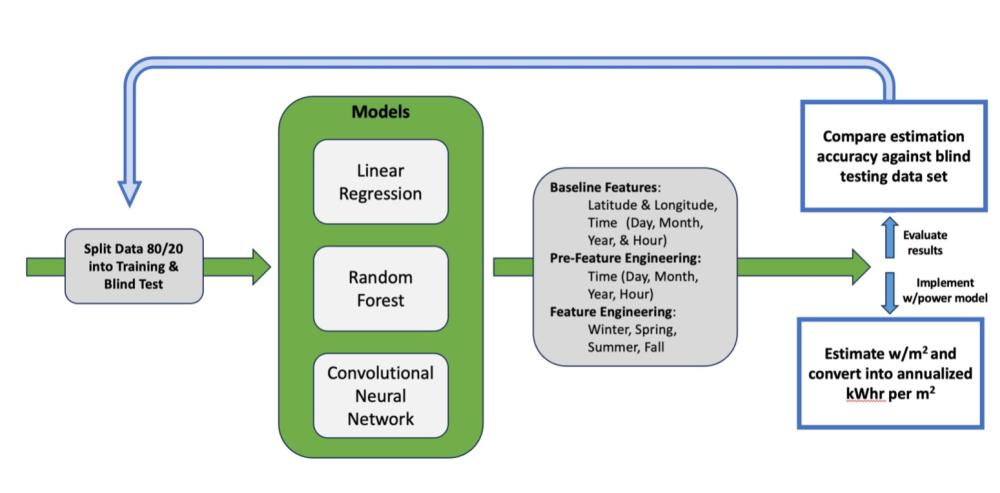
Model Selection: To estimate GHI, three models were pursued: linear regression, random forest, and a convolution neural network (CNN). The original features used in training these models included location (latitude & longitude), time (month, day, hour, minute), and the target variable of GHI (watts per square meter). Additionally, engineered features such as season were introduced but were found not to result in an improvement in model performance. The dataset was split into training and testing sets, with 80% of the data used for training and 20% held blind for testing. The split was determined temporally rather than by location, ensuring that blind testing data represented periods not seen during training rather than unseen locations. The predicted values were compared against the actual GHI values of the blind testing sets and evaluated using metrics such as R-squared, Mean Squared Error, Root Mean Squared Error, and Mean Absolute Error. Among the models, the CNN was ultimately chosen but performed with very similar accuracy to the random forest model. With the finalized model, an annual GHI estimate (kilowatt-hour per square meter) can be produced for a user specified location. In conjunction with the Residential Energy Profile model, the estimated solar panel area to meet a home’s annual power requirements can be determined.
IV. Assumptions and Limitations
Our product was built to serve as a first-stop-shop for homeowners that want to install rooftop solar PV systems to help reduce energy costs, and to move towards sustainability. With that goal in mind, our tool is built on the following assumptions:
- Both the residential energy requirements and the solar irradiation potential are operating at the annual/yearly timescale As we know there may be times in the day (if cloudy), or at night, when the solar PV system will not be able to meet the full requirements of the house, even if it is sized accordingly. Our team understands that this is a limitation, but it is not very significant because this tool is designed as a first-stop-shop for aspiring solar adopters, who want a high-level idea of how many solar panels they need.
- The residential energy profile model is trained on varying levels of appliance efficiencies, which does out include super-specialized, one-off, electrical appliances, that a small fraction of homeowners may have. For example if a homeowner has a large de-humidification system for an in-house art gallery space, our tool would not be able to take that into account while providing solar PV system size estimates.
- Lastly, our model assumes the solar panel parameters as follows:
- Solar panel size = 18 sq-ft
- Solar panel efficiency = 17%
- System electric losses = 20%
- Solar panels are fixed and horizontal
V. Future Roadmap
For future iterations of the product we aim to do the following:
- Conduct the analysis at the hourly scale, instead of the yearly/annual scale. This will allow us to account for local buy-back and peak shaving program incentives.
- Include any utility incentives on equipment into the potential $ savings estimates
- Provide the homeowners with an option to select the efficiency of solar panels, orientation, and layouts
- Conduct intensive user testing to gain feedback on usability of the tool


