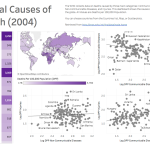
A visual that shows global cause of death statistics from 2004. Intended use for health conscious travelers and public health enthusiasts
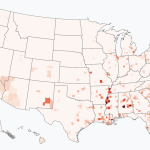
An unbiased look at trends in gun violence statistics.
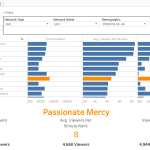
Why is everyone around me getting Ebola? This data visualization project seeks to build basic intuition about epidemiology using simple compartment…


")
")