CalEmber: A Fire Damage Prediction & Insurance Assessment Tool
Problem & Motivation
In recent California history, there has been an uptake in wildfire events and related disasters that ravage through homes and neighborhoods. As recently as 2018, California has witnessed some of the deadliest wildfires in state history, averaging more than 7,000 wildfires each year (Miller & Mossburg, 2022). These wildfires have not only increased in severity, but moved from rural areas to neighborhoods, now impacting many individuals who live in high fire risk areas. Regardless of the uptake in fires, the California homeowners' market continues to grow, with a 12.3% increase in homes sold year-over-year (Redfin, 2024). Due to the rise of increased risks and home purchases in California, the homeowners' insurance market has experienced significant losses. Some of California’s largest property insurers, such as State Farm, Allstate, Farmers, and USAA have limited or stopped writing new policies in California altogether.
In order to stay in the market, insurers are asking to use forward-looking wildfire risk models to calculate rates, which differs from the current regulations in place that only allow the use of historical data. If such regulations are approved, home insurance premiums will increase significantly, and are already on the rise. For example, Allstate has increased rates up to 34.1-650% due to heightened fire risk and coverage shortages (Munce, 2024).
To quantify the California wildfire and insurance market, the total California wildfire cost from 1980-2021 is over 87 billion USD (NCEI, 2024). There is a 9 billion dollar California property insurance market for annual premiums (CA Department of Insurance, 2023), and there were over 350,000 residential properties sold in California just over the past year (ATTOM Data, 2024), so there's huge potential for impact here. In response, CalEmber aims to address the growing challenges faced by current and prospective California homeowners by providing comprehensive insurance and fire damage insights in one streamlined tool, empowering people to make informed decisions about insurance coverage and wildfire damage risk.
Data Source & Data Science Approach
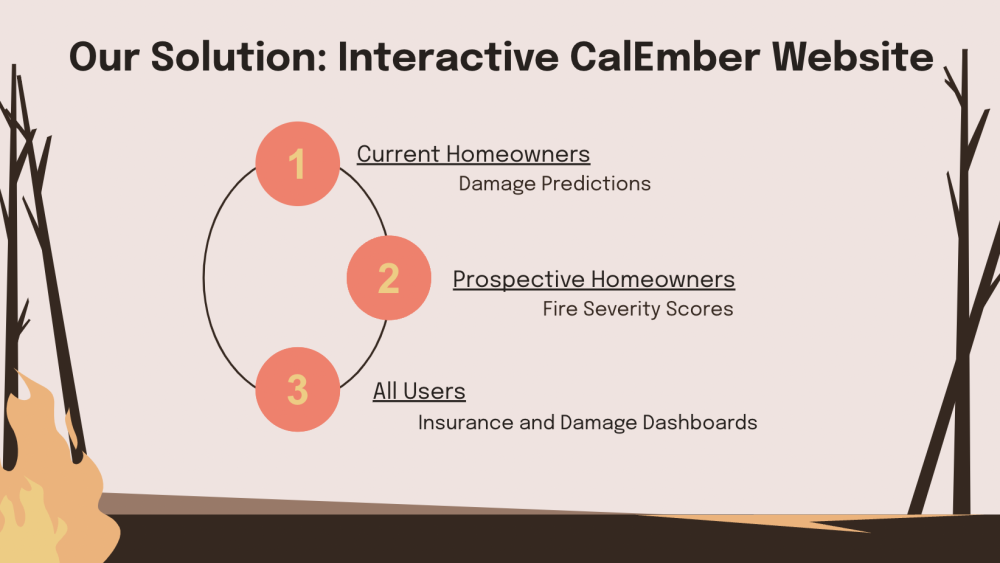
In order to gain more insights regarding this issue, we conducted an interview with Micah Mumper, a research data specialist at the California Department of Insurance. He helped us learn more about how insurance companies calculate premiums using regression modeling with adjusted base rates based on metrics such as home location and features, giving us insight on how we could approach our project. We also learned about the issue of uninsured homeowners, noting that while the state of California doesn't require home insurance, many people with paid-off properties remain uninsured despite wildfire risks. After this interview, we finalized CalEmber as an interactive web based tool to target two major demographics: current homeowners and prospective homeowners. Through this tool, current homeowners will have the ability to input their location and housing characteristics to receive a potential wildfire damage prediction score. For prospective homeowners, they will be able to input zip codes and receive a fire severity score. Finally, all users will be able to explore our visual dashboards, presenting fire damage and insurance information across California.
The dataset for our damage prediction model is the CalFire Damage Inspection Database of Structures Damaged or Destroyed by Wildfires in California Since 2013. Key categories include home metrics such as roof type and location, and risk features such as combustible materials, eaves, and vent screens. The output of our model will be damage levels that indicate the percentage of the structure impacted by wildfires and is split up into five distinct categories, ranging from no damage to destroyed. Some key preprocessing steps taken for this dataset include using AWS location services to transform latitude and longitude into zip code, one-hot-encoding categorical variables, and transforming the damage levels to an ordinal scale from 0 to 4. Secondary data sources include the California Department of Insurance Personal Property Experience data, which provides information on fire losses, insurance premiums, and metrics used for CalEmber’s interactive dashboards. We also used the Fire Hazard Severity Zones data provided by CalFire that classifies regions in California with moderate, high, and severe fire severity risk scores, which is used for CalEmber’s zip code severity look-up tool.
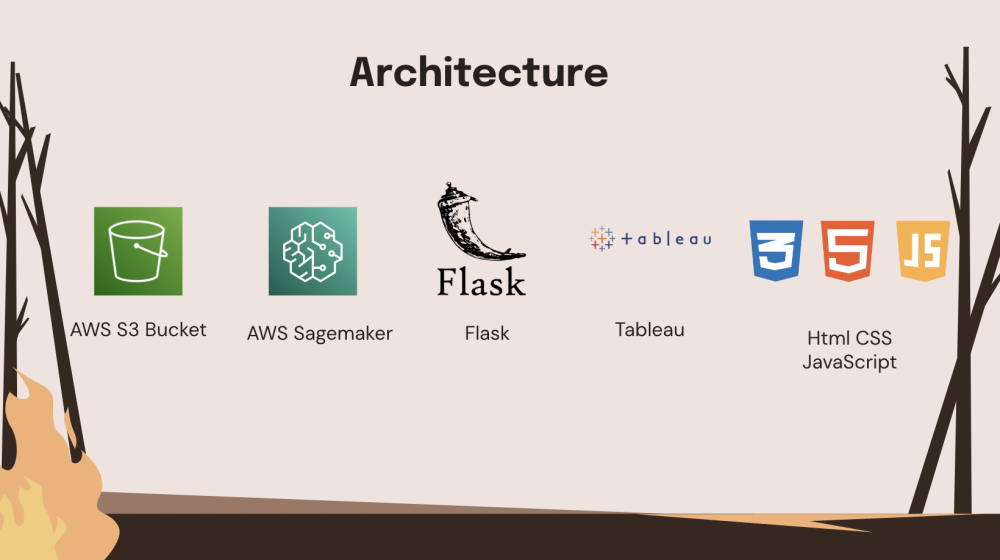
In order to get a better understanding of our data, our team conducted extensive exploratory data analysis. Of note, we found that there are no distinctive year-over-year patterns in fire losses and that insurance premiums increase in regions with high fire severity. To touch on the architecture of our solution, we stored and checkpointed all our data on an AWS S3 bucket. We used AWS Sagemaker to build and train all our model pipelines. Our final model was built using the Sagemaker API, and deployed onto a Sagemaker endpoint. We incorporated that endpoint onto our web app using Flask. Finally, we used Tableau to create all the dashboards and embed them onto our website. The web app were built using HTML, CSS, and Javascript, and deployed via Heroku.
Evaluation
For our damage predictions, we tested 8 models ranging from Regressions to Boosting methods, starting with a Baseline model that predicts the majority class of damage level 4 in all instances and has a 57.9% accuracy. Linear Regression, Logistic Regression, and Recurrent Neural Network models all performed worse than the Baseline model, but helped to provide information on important model features and insight that there is no sequential pattern between damage levels and input metrics. Results started to look more promising when we tested K-Nearest Neighbors, which is well suited for geographic regions. This led to Support Vector Machines and subsequent tree-based models including Random Forest, LightGBM, and XGBoost which are better at handling complex relationships and achieve higher accuracies. However, these models performed the best for majority damage levels 0 and 4, and were unable to accurately predict the minority damage levels of 1, 2, and 3, implying that there is a class imbalance problem in our data. The team produced a confusion matrix for the result of the XGBoost model, which performed the best out of all tested models. The overall accuracy of that model was 93%, but low precision implies that there are many false positives. A low recall score implies that there are many false negatives, and a low F-1 score (balance of precision and recall) indicate that the initial XGBoost model did not perform well for damage levels 1, 2, and 3. To deal with the class imbalance problem, we used SMOTE, or synthetic minority oversampling technique, to oversample minority classes for training. We also conducted Random Grid Search to find optimal model parameters as well as combining multiple models into a voting classifier. However, even with these techniques there were minimal improvements.
At this point, the team decided to take a step back by framing our modeling challenges to the use case, and we realized that homeowners may have a hard time differentiating the minority classes regardless of model performance. A 10% vs. 15% difference in structural damage may not be discernible to homeowners, yet leads to different damage predictions. So, to simplify our approach and make our tool more intuitive, we decided to reframe the damage levels into three main categories, which include 0% damage for no damage, 1-50% for moderate damage, and greater than 50% for destroyed. Based on the new damage classes, we went through another round of optimization, and specifically focused on dimensionality and feature reduction to reduce the number of input features in the model from 60 down to 30. Most of those features were one-hot-encoded, so even though there were 30 features in the final model, there were only 12 unique metrics used. Finally, we did another round of hyperparameter tuning for the XGBoost model, resulting in some key final metrics which include the use of L1 and L2 regularization to help reduce the usage of features that are not important to the model, and also help keep the model from becoming overly complex. 100 individuals decision trees were used for the model with a maximum depth of 10 for each tree to help limit overcomplexity or extremely long trees, and 60% of the features were used for each tree to make sure all trees were diverse and different.
Our final model results did improve with a 94% accuracy and higher precision and recall scores for the moderate damage category. The team conducted feature importance testing to see which features were the most important in damage predictions based on the F-score, which is a tally of the number of times each feature was used in creating decision tree splits. We found that location had the largest impact on damage predictions, followed by the tax assessed home value, and home metrics such as patio carport type, combustible materials, exterior siding, and multi-pane windows.
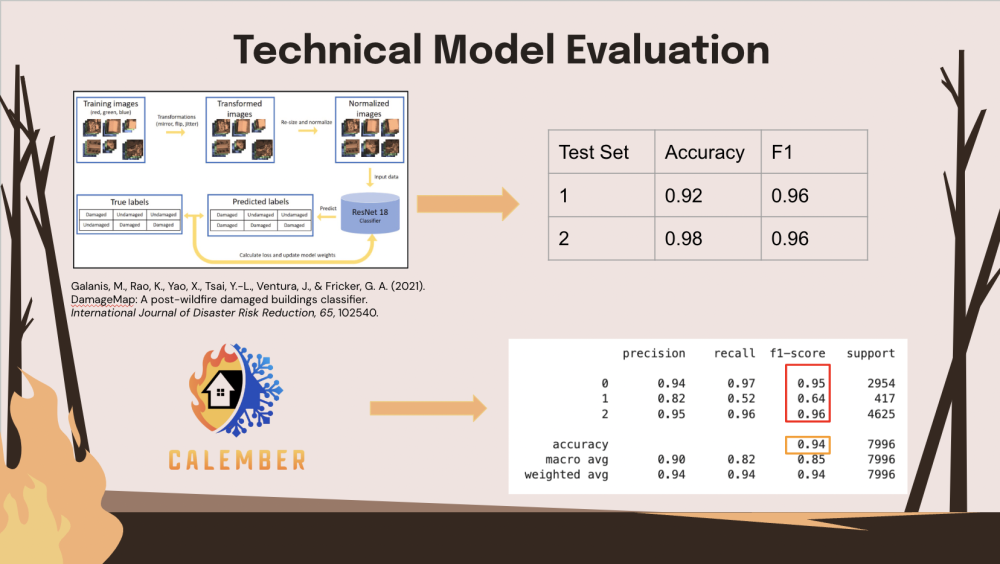
The team also looked into existing research on adjacent topics to perform a technical model evaluation against an alternative implementation of this solution. The most similar published study we found is from the International Journal of Disaster Risk Reduction, which used satellite imagery to train a binary classifier that determines the degree of damage of buildings after a wildfire event, so their approach is a bit different from ours. Nonetheless, they used the same evaluation metrics, and got a 92% and 98% accuracy on two different test sets with an F-1 score of 0.96 on both, so our final model comes pretty close to theirs by comparison, with a 94% accuracy and roughly 0.96 F-1 score.
Key Learnings & Impact
In summary, our model provides a great deal of insight from the homeowners' perspective. Firstly, location matters the most, with location-based factors determining important decision steps in our model. Second is protective measures; although location is ranked first in feature importance, home metrics do also make a difference, and fire safety measures such as vent screens and non-combustible materials can help homeowners protect their properties. Finally, taking preventative measures is valuable; even if location is not a variable that can be easily changed by homeowners, taking steps to defend your home preemptively can definitely impact and limit future levels of damage on properties.
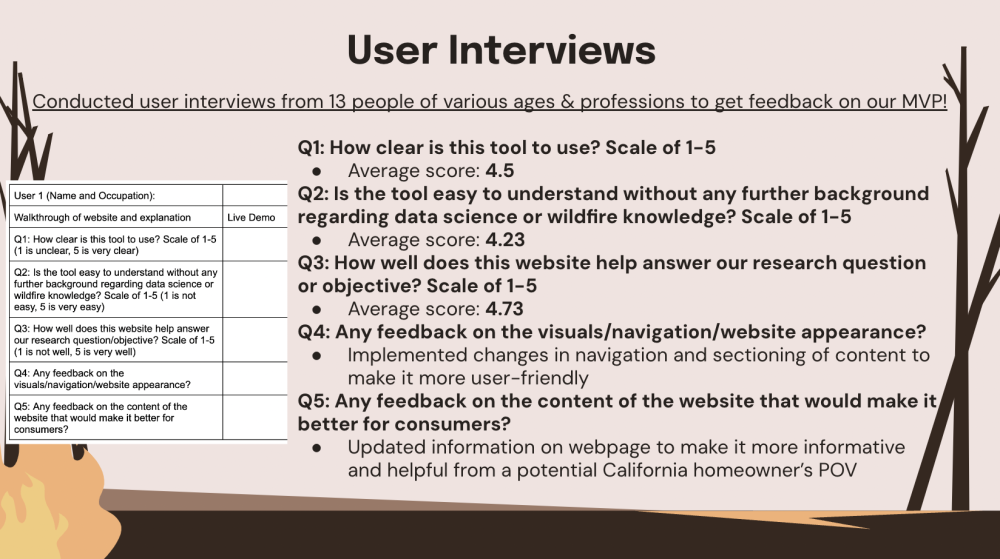
Our team also conducted user interviews from 13 people of various ages and professions in order to receive feedback on our solution. A mix of quantitative and qualitative questions were asked, and the results from our user demos are as follows. When asked how clear the tool was to use, our average response score was 4.5 out of 5. When asked how easily it was to understand the tool without additional background regarding data science or wildfires and insurance, the average score was 4.23 out of 5. When asked how well the solution answers our team’s research objectives, the average score was a 4.73 out of 5. In terms of qualitative feedback regarding the website appearance and visuals, we implemented changes in navigation and sectioning of content on our website to make it more user-friendly. For feedback on the content of our solution, we updated the information to make it for informative and helpful from a potential California homeowner’s point of view.
To touch a bit on some ethics and privacy concerns, it’s important to be mindful of the potential of unexpected use cases, such as people using the tool in unintended ways, the limitations of our data, and the possibility of re-identification. Our team does our best in order to minimize these potential concerns via conducting user demos and implementing feedback through several iterations of our solution. The link to CalEmber's published website can be found here and at the bottom of this webpage, as well as a video walkthrough of our solution.
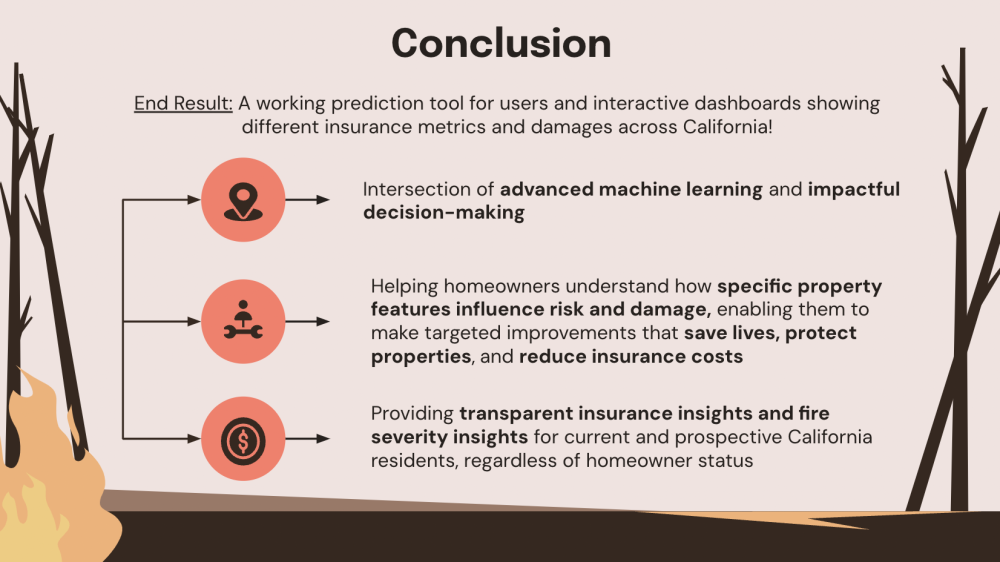
In conclusion, our efforts on this data science project have proven to be very fruitful. We created a unique new dataset for this project, and implemented multiple optimized machine learning models. Team members became more familiar with AWS, and finally, we created and deployed a website to host our solution on. Our end result is a working prediction tool that uses advanced machine learning methods to help homeowners understand how specific property characteristics impact wildfire risk and damage, allowing them to make informed decisions regarding wildfire safety, property protection, and home insurance. Our solution provides transparent insurance and fire severity insights for current and prospective California residents. CalEmber empowers existing and future California homeowners by providing transparent information on fire damage and insurance rates using data driven insights - results they can trust!
Acknowledgements
We extend our deepest gratitude to our advisors, Joyce Shen and Morgan Ames, for their invaluable feedback and steadfast support throughout the semester. We also wish to express our sincere appreciation to Micah Mumper, Research Data Specialist at the California Department of Insurance, for sharing his domain expertise. Finally, we thank our colleagues, friends, and family for their participation in user testing and for providing insightful feedback that greatly contributed to the success of this project.
Datasets
- Fire Hazard Severity Zones from California Open Data Portal [link]
- Residential Property Insurance from CA Department of Insurance [link]
- Property Market Share Data by California Department of Insurance [link]
- Zip Code Level Premium & Exposure data from CA Department of Insurance [link]
- Data and Analysis and Wildfires and Insurance from CA Department of Insurance [link]
- California Fire Incidents from CalFire [link]


