GreenCompute
Problem & Motivation
Data centers, the backbone of the digital economy, consume vast amounts of energy and contribute significantly to global carbon emissions. With increasing pressure from regulatory bodies, stakeholders, and consumers to adopt sustainable practices, data center operators face challenges in monitoring and reducing their environmental impact.
GreenCompute addresses this gap by offering a user-friendly, data-driven platform to track carbon emissions and provide actionable recommendations to optimize energy efficiency and minimize emissions.
Data Source & Data Science Approach
GreenCompute offers two key features: data center carbon footprint estimations and a chatbot to answer questions on best practices to improve efficiency. Each of these two features employs a different approach: the former, a classical ML approach; the latter, a GenAI approach.
Classical ML: Data Center Carbon Footprint Estimations
In the classical ML approach, the goal is to train various regression models that will yield predictions which we will use in calculating a data center’s carbon footprint.
We utilize publicly available datasets, including:
- SPEC Power Database: Provides server power metrics for energy consumption analysis.
- LBNL Data Center Tools: Offers insights into energy efficiency and carbon estimates.
- SCI Guidance Project: Contains embodied carbon emissions data for various data center machines.
Our exploratory data analysis includes:
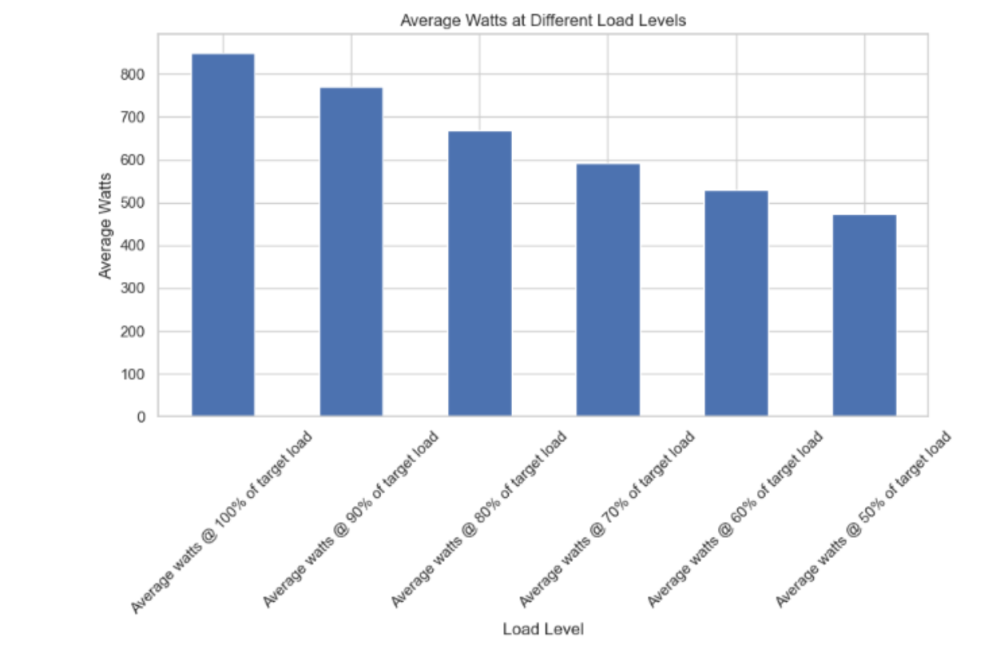
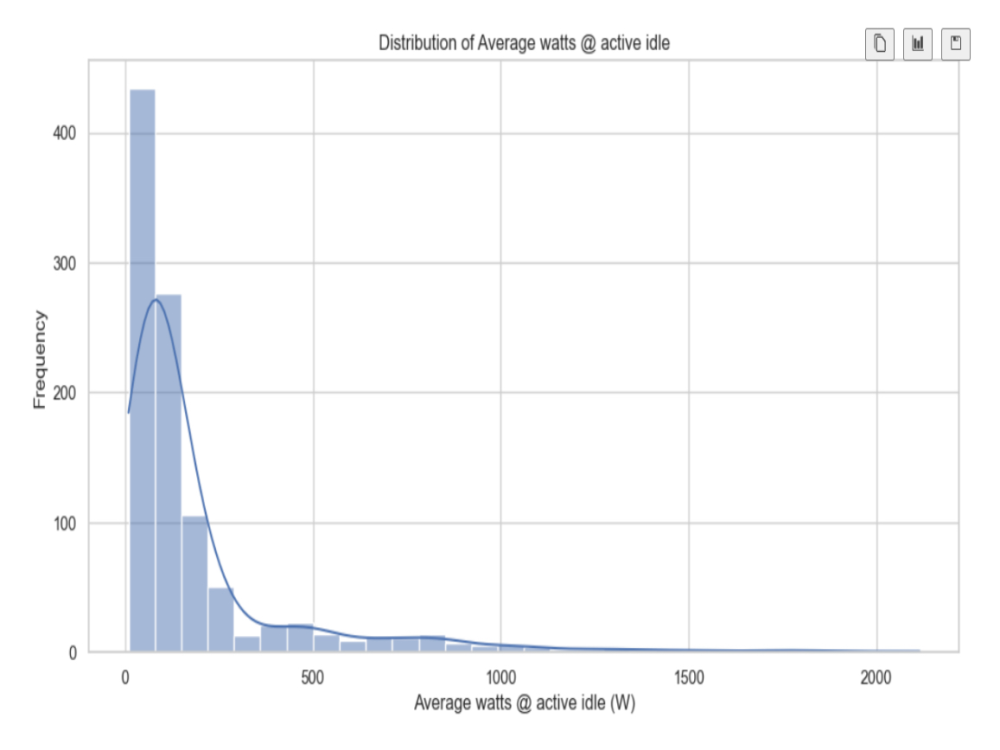
- Servers and data centers account for a significant portion of global IT electricity usage. Power @ 50% load demonstrates how power scales with operational demand. Efficient hardware minimizes electricity usage at varying loads. Active Idle Power is the power consumption of IT equipment (e.g., servers, storage) when powered on but not actively processing workloads. It represents the baseline energy usage of systems in standby, ready to handle incoming tasks.
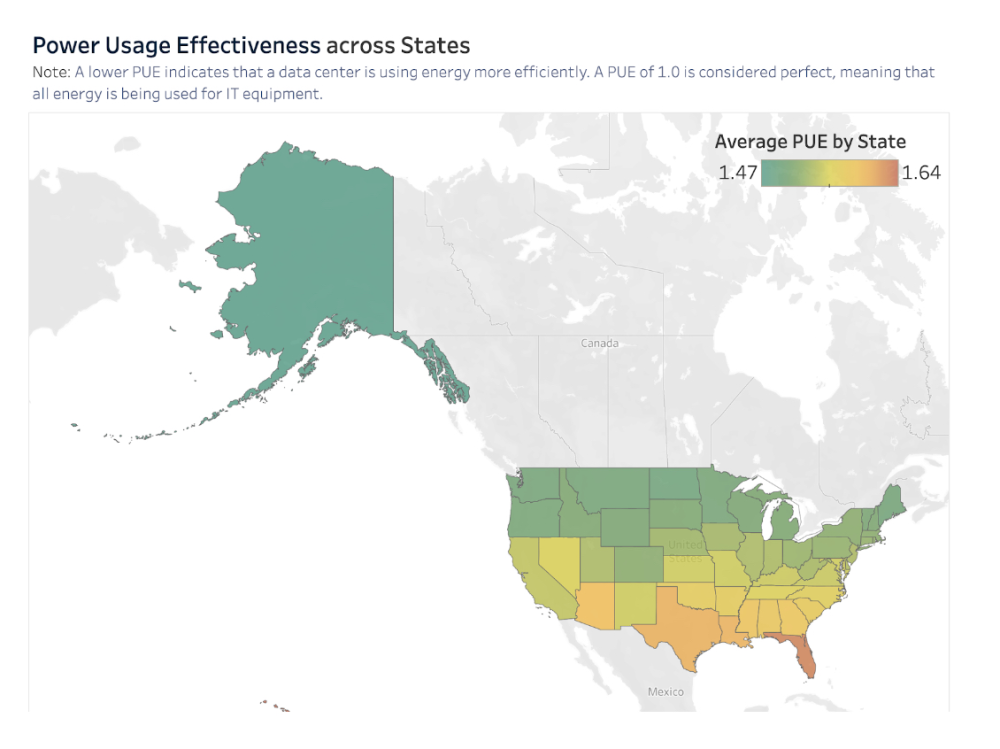
- PUE is heavily climate dependent. Cooler, less humid climates allow for more economization (free cooling). Some cooling systems are more efficient than others.
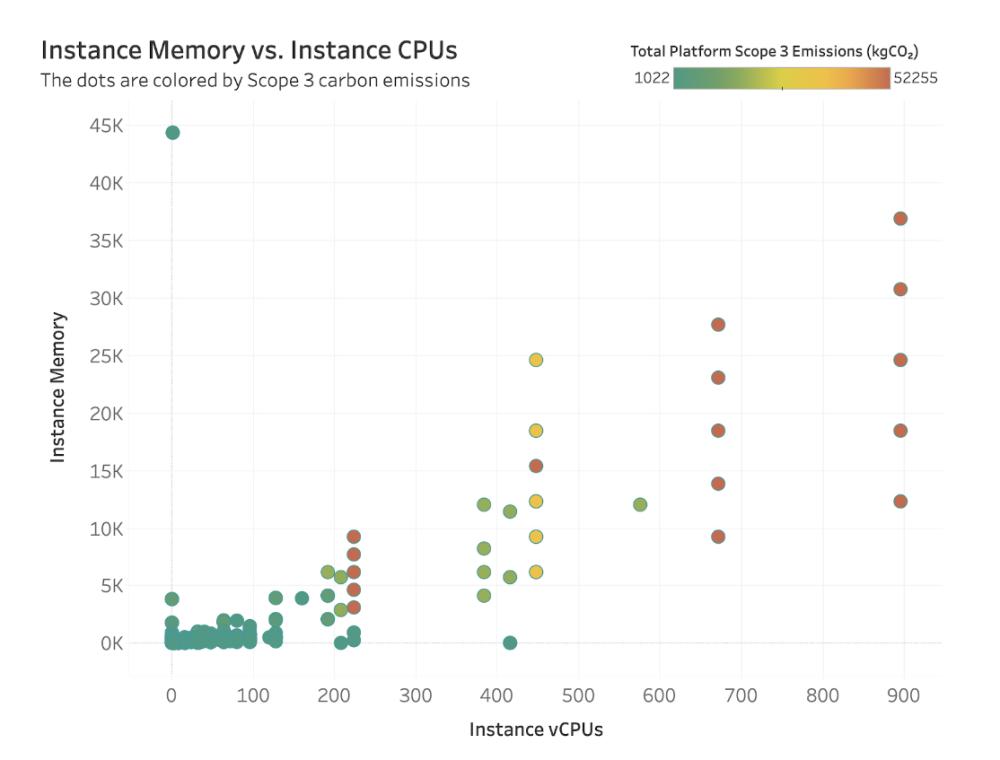
- Larger the memory and the number of CPUs generally exhibit larger embodied carbon emission. Similar values of memory or CPU count often resulted in a wide range of emission levels, suggesting that the relationships were not linear.
To streamline analysis of our datasets, we reduced dimensionality using correlation metrics and random forest importance scores. With additional critical domain insights, we identified key independent variables:
- From the SPEC dataset: Memory capacity, number of cores, and CPU counts.
- From the PUE dataset: Location and cooling system type.
- From the Cloud Carbon dataset: Memory capacity and CPU counts.
After data preprocessing and feature engineering, we tested multiple models and selected the most accurate:
- Gradient Boost Regressor to predict IT equipment electricity consumption.
- Random Forest to predict active idle power.
- XGBoost to predict embodied carbon
- XGBoost to predict PUE (Power Unit Efficiency)
Finally, we calculated the average annual power draw per server by combining active idle power and IT equipment electricity consumption. By factoring in PUE, server count, and constants, we determined the data center's carbon footprint. Adding the embodied carbon estimate yielded the total annual energy consumption—a key result of our analysis.
GenAI: Chatbot Recommendations
The GenAI approach employs a traditional RAG (Retrieval Augmented Generation) chatbot, which is composed of the following steps:
- Document content extracted, chunked, and embedded into vector db
- User sends a query
- Query is vectorized and similarity search is conducted against our vector db
- Top-n most similar documents are returned and passed to the LLM with a custom prompt
- Answer is returned to the user
The document content that we use comes from the Center of Energy Expertise library. With our SME, we indexed a select group of documents which were focused on increasing data center efficiency and had a focus on small to medium sized data centers.
Evaluation
Our solution is evaluated through:
- Model Accuracy: Achieving a high R-square and low Mean Squared Error (MSE).
- Chatbot Metrics: Ensuring a high correctness score in our chatbot responses
Classical ML: Data Center Carbon Footprint Estimations
We tested various models and selected the most accurate for each prediction task. We used a Gradient Boost Regressor to estimate IT equipment electricity consumption, a Random Forest model for active idle power, and XGBoost for predicting embodied carbon and PUE.
To ensure reliable model performance, we focused on Mean Squared Error (MSE) and R-square ($R^2²$) as our evaluation metrics:
- R-square: Measures how well the independent variables explain the variance in the dependent variable. A higher $R^2²$ indicates the model effectively captures patterns in the data, helping us understand the relationships between features and outputs.
- Mean Squared Error (MSE): Quantifies the average squared difference between predicted and actual values, penalizing larger errors. This metric ensures the model minimizes prediction inaccuracies, critical for precise estimations of carbon footprints and energy consumption.
By combining these metrics, we can assess both the model's predictive power ($R^2²$) and its accuracy (MSE), ensuring robust and actionable results for data center carbon footprint estimation.
| Target Variable | Model | MSE | R² |
|---|---|---|---|
| Embodied Carbon | Linear Regression | 0.23 | 0.53 |
| Embodied Carbon | Decision Tree | 0.10 | 0.80 |
| Embodied Carbon | Random Forest | 0.08 | 0.83 |
| Embodied Carbon | XGBoost | 0.06 | 0.87 |
| IT Electricity | Random Forest | 14,409 | 0.96 |
| IT Electricity | XGBoost | 8,339 | 0.97 |
| IT Electricity | Neural Network | 18,455 | 0.94 |
| Active Idle Power | Random Forest | 3,794 | 0.92 |
| Active Idle Power | XGBoost | 5,573 | 0.89 |
| Active Idle Power | KNN | 21,496 | 0.57 |
| PUE | Linear Regression | 0.026 | 0.633 |
| PUE | Decision Tree | 0.025 | 0.644 |
| PUE | Random Forest | 0.025 | 0.644 |
| PUE | XGBoost | 0.025 | 0.644 |
GenAI: Chatbot Recommendations
To evaluate our RAG chatbot, we first generated a synthetic dataset of question and answer pairs and had our SME remove questions which were deemed irrelevant for our application (~5%). We then used correctness as our evaluation metric, which is based on the G-Eval framework. In this framework, an LLM is used as a judge to determine if the provided answer is correctly answering the given question.
We employed three different prompting strategies which we evaluated: a base prompt, a more advanced prompt, and an optimized prompt. The base prompt used a simple “Using the context provided, give an answer.” The advanced prompt added a role component and more context on a data center. Finally, the optimized prompt (which was optimized with DSPy framework), provided extensive role and context descriptions along with a Chain-of-Thought approach with multiple question/answer pair examples. The results of each strategy can be seen below:
| Prompt Type | Correctness Score (%) |
|---|---|
| Base | 66.67 |
| Advanced | 88.40 (+21.73) |
| Optimized | 92.14 (+3.74) |
Architecture and Deployment
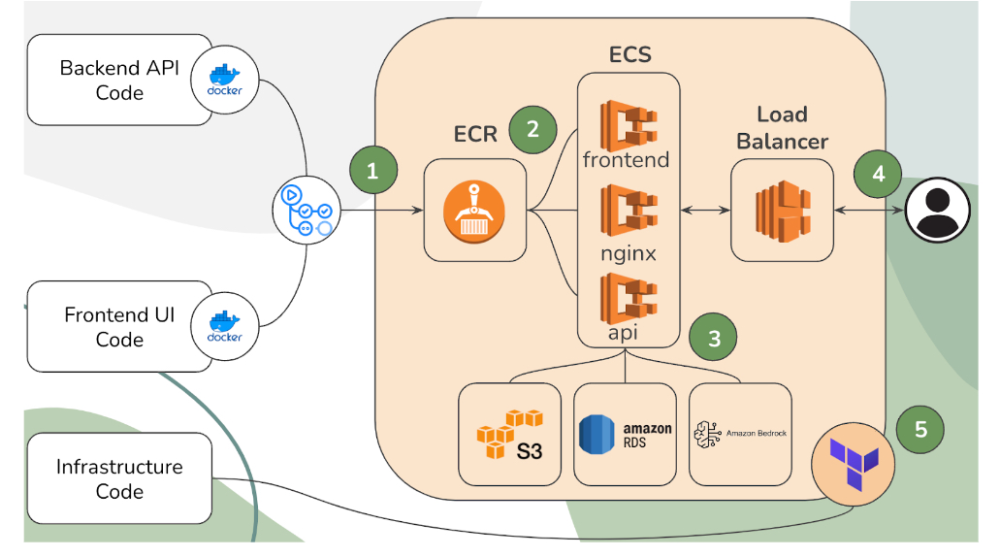
The GreenCompute platform is underpinned by a microservices architecture designed for scalability and maintainability. An overall view of the deployed components is featured below:
The deployment sequence is the following:
- API/Frontend code image built and stored in ECR via Github Actions
- AWS ECS pulls images and runs on ECS task
- AWS ECS API task connects to AWS RDS, S3, and Bedrock to load data and models
- Load balancer attaches to AWS ECS and serves as entrypoint for users to the frontend via NGINX proxy
- Entire infrastructure deployed with the help of Terraform (IaC)
Key Learnings
- Our key learnings were derived from conversations with potential users who are experienced researchers or operators in the data center world. From our interviews with this group of individuals, we found that:
- Simplicity is key. Facilitating the input of information gives GreenCompute a great advantage over current tools which employ tedious ways of collecting user input.
- References to our source material are highly valued. By linking to the sources our RAG chatbot utilizes, users can follow up and conduct deeper research on the recommendations provided.
- Users want to further personalize their experience. We heard several comments about how each data center is different and that capturing these differences would greatly improve the user experience.
- There are a lot of questions about AI. With the hype around AI, data center researchers and operators are more curious than ever about how the use of AI will impact their field and how they can leverage the technology to keep up.
Impact
- Developed and unified energy and emission regression models to facilitate visibility on a data center’s footprint
- Empowers data centers to reduce carbon emissions, supporting global climate goals.
- Assists organizations in meeting ESG reporting requirements.
- Provides decision-makers with tools to balance sustainability with operational efficiency.
Future Work
There are three main areas to explore in the future:
- Streamlined user experience - to collect granular information on the user’s data center for improved data features
- More personalized data center recommendations - by using the user’s input along with a wider range of expert corpora as context for our RAG chatbot, we can provide tailored recommendations for the user’s data center
- Time series forecasting - by providing a means of storing historical compute data, we can create time series forecasting models that could help users get a better understanding of their long term data center energy usage
Acknowledgements
We extend our gratitude to our project advisors, UC Berkeley W210 course instructors, and the organizations providing access to datasets. Special thanks to the teams behind LBNL and SPEC for their invaluable resources.


